Situating strategic planning and budgeting within the organization and administration of higher education institutions, this text provides effective and proven strategies for today's change-oriented leaders. Bringing together distinguished administrators from two-year, four-year, public, and private colleges and universities, this volume provides both practical and effective guidance on the intricacies of the institutional structure, its functional activities, and contingency planning. Organization and Administration in Higher Education orients future administrators to the major areas of an academic institution and will assist higher education administrators in leading their institutions to excellence.
New in this Second Edition:
New chapters on the impact of Title IX and social media on higher education.
Updated coverage throughout on politics, technology, budgeting, program planning, and institutional changes.
New end-of-chapter discussion prompts.
Trusted by 375,005 students
Access to over 1.5 million titles for a fair monthly price.
Part I Higher Education Institutions and the People in Them
1 UNDERSTANDING THE RANGE OF POSTSECONDARY INSTITUTIONS AND PROGRAMS
Angela E. Henderson and Kristina Powers
INTRODUCTION
When traveling, be it for business or for pleasure, we tend to compare and contrast our new location with more familiar surroundings. The new location may be bigger or smaller, more or less diverse, or warmer or colder than our current home. Having a common set of criteria for evaluation allows us to make comparisons and get acclimated. The same is true for higher education institutions and, thanks to a national database with a common set of definitions and variables, it possible to compare more than 7,000 postsecondary schools that submit federal data to the National Center for Education Statistics (NCES) each year.
Current and future administrators seeking to better understand the higher education landscape will benefit from this chapter’s detailed descriptions of types of institutions and quality indicators that key external stakeholders such as parents, prospective students, legislators, and media focus on when evaluating an institution. Key internal stakeholders such as presidents, vice presidents, deans, and directors also focus on quality indicators, but do so with unique management challenges described herein.
PRIVATE, PUBLIC, AND PROPRIETARY
Within the general structure of higher education, there are two main categories of postsecondary institutions: public and private. Private institutions are further divided into two types: not-for-profit and for-profit (proprietary).
Public Institutions
The National Center for Education Statistics defines a public institution as “an educational institution whose programs and activities are operated by publicly elected or appointed school officials and which is supported primarily by public funds” (IPEDS, n.d.b, para. 44). Public institutions include a variety of levels and program offerings, from two-year community colleges to doctorate-granting research-level universities. In 2014–15, public institutions constituted 35% of the degree-granting postsecondary institutions in the United States that submitted data to NCES, with a total enrollment of over 14.6 million students (IPEDS, n.d.a). The key commonality among these institutions is that they all receive some form of public funding.
The number of public institutions in the United States has increased in the last 30 years. In fall 1980, there were fewer than 1,500 public degree-granting institutions, the majority of which were two-year colleges (NCES, 2014). Public four-year degree-granting institutions were less plentiful, comprising less than 40% of all public degree-granting institutions (NCES, 2014). Enrollment at degree-granting public institutions totaled nearly 9.5 million, which represented more than three-quarters (78%) of all students attending postsecondary institutions in 1980 (NCES, 2014). By fall 2014, the number of public degree-granting institutions had risen to just over 1,700, a 14% increase from 1980 (NCES, 2014). As the number of public degree-granting institutions has grown, so too has their total enrollment, to over 14.6 million in fall 2014, a 54% increase from 1980 (NCES, 2014).
Private Institutions
While public institutions receive some public funding, private institutions are “usually supported primarily by other than public funds, and operated by other than publicly elected or appointed officials” (IPEDS, n.d.b, para. 33). They must therefore fund all costs through private means, such as tuition. Private institutions utilize one of two financial structures: not-for-profit or for-profit (or proprietary). Not-for-profit institutions operate similarly to non-profit organizations in that surplus revenue must be directed to institutional goals. For-profit institutions have no restrictions on surplus revenue, but are arguably subject to greater accountability than their counterparts.
Because private institutions do not receive public funding, they have the flexibility to provide educational experiences not available at public institutions, such as faith-based programs. Like their public counterparts, private institutions include two- and four-year postsecondary schools with various degree programs and specialties. In 2014–15, private institutions constituted 65% of the degree-granting postsecondary institutions in the United States that submitted data to NCES, with a total enrollment of nearly 5.6 million, or 28% of all students enrolled (IPEDS, n.d.a). The 35% of private institutions classified as private not-for-profit enrolled 4 million students, and the 30% classified as private for-profit enrolled over 1.5 million (IPEDS, n.d.a). Similar to the trend shown by public institutions, the number of private institutions rose between 1980 and 2014; however, the increase was much greater—84% during that timeframe (NCES, 2014).
Private Not-for-Profit Institutions
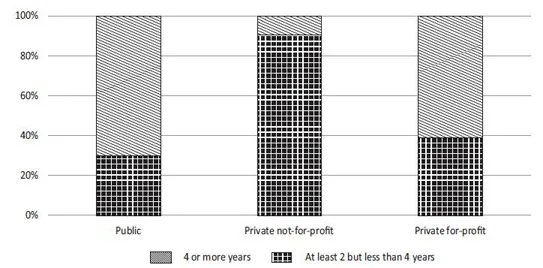
Despite the overall growth in private institutions, the total number of degree-granting private not-for-profit institutions increased by only 10% from 1980 to 2014. Figure 1.1 illustrates the distribution of private not-for-profit degree-granting institutions by type as of 2014 (NCES, 2014). With the gain in the number of four-year private not-for-profit degree-granting institutions, total enrollment grew to more than 4 million students, an increase of 60% over fall 1980 (NCES, 2014). Enrollment at private not-for-profit degree-granting institutions grew by 66% at four-year institutions; however, enrollment at the two-year institutions dropped by nearly 73% during the same time (NCES, 2014).
Private For-Profit Institutions
The slight growth in private not-for-profit degree-granting institutions was overshadowed by the considerable growth in private for-profit institutions. While only 165 private for-profit degree-granting institutions existed in fall 1980, by fall 2014 there were 1,457; a nearly 800% increase (NCES, 2014). The number of four-year institutions rose most dramatically, from 20 to 784, an increase of over 3,800% (NCES, 2014). The number of two-year institutions also grew, from 147 to 673, or 358% (NCES, 2014). As illustrated in Figure 1.1, the distribution of two- and four-year private for-profit degree-granting institutions was nearly even, at 46% and 54% respectively, by fall 2014 (NCES, 2014).
As would be expected with such a substantial increase in the number of institutions, enrollment at private for-profit degree-granting institutions rose sharply. In fall 1980, just over 110,000 students were enrolled at private for-profit degree-granting institutions—less than 1% of all students attending postsecondary schools (NCES, 2014). By fall 2014, that number had increased by nearly 1,300% to 1.5 million students, or nearly 8% of all postsecondary students (NCES, 2014). Four-year degree-granting institutions accounted for much of this overall growth; their enrollment totaled nearly 1.3 million students in fall 2014, an increase of 4,400% from 1980 (NCES, 2014). While two-year degree-granting institutions also experienced enrollment growth, the gain (244%) was not as dramatic (NCES, 2014).
Overall Geographical Distribution of Institutions and Enrollment
In 2014, over 4,800 degree-granting colleges and universities in the United States with a collective enrollment of over 20 million students provided data to the National Center for Education Statistics (NCES), a division of the U.S. Department of Education responsible for collecting and analyzing data related to education (IPEDS, n.d.a). Public degree-granting institutions represented 35% of the respondents and enrolled nearly three-quarters of all students (approximately 15 million), while private degree-granting institutions enrolled nearly 5.6 million students (IPEDS, n.d.a).
Figure 1.1Distribution of Institutions in the U.S. by Control and Type, 2014
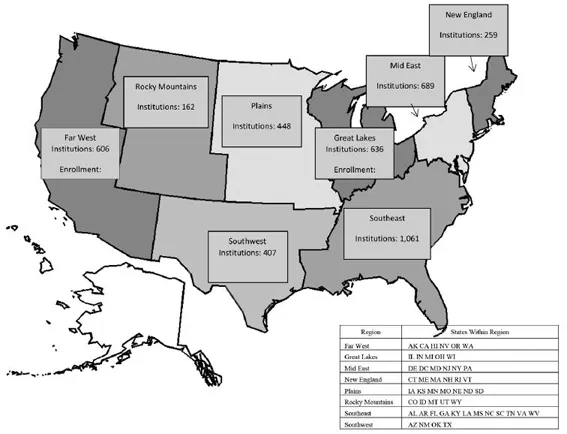
Figure 1.2Distribution of Carnegie Classified, Degree-Granting, U.S. Institutions and Enrollment by Region, 2014
Figure 1.2 shows the total number of degree-granting institutions and students enrolled in each of eight regions (as defined by NCES) of the United States as of 2014 (IPEDS, n.d.a). The Southeast region, which includes 12 states (Alabama, Arkansas, Florida, Georgia, Kentucky, Louisiana, Mississippi, North Carolina, South Carolina, Tennessee, Virginia, and West Virginia), accounts for the largest percentage of institutions and student enrollment: 27% of all institutions and 23% of total enrollment. More institutions lie within the Southeast region than in the New England, Rocky Mountains, and Southwest regions combined. Overall, the Southeast region contains the highest number of public and private for-profit institutions, while the Mid East region contains the highest number of private not-for-profit institutions.
CLASSIFICATION OF INSTITUTIONS
Since the 1970s, degree-granting postsecondary institutions in the United States that have attained accreditation and that report data to NCES have been classified using the Carnegie Classification system (Carnegie, n.d.a). The Carnegie Commission’s efforts to organize “a classification of colleges and universities to support its program of research and policy analysis” prompted the development and implementation of the categorization process (Carnegie, n.d.a, para. 1). The classifications include all U.S. Title IV eligible, degree-granting colleges and universities that must report data to the National Center for Education Statistics and that conferred degrees in the year prior to the classification update (Carnegie, n.d.c). Of the 4,888 institutions that reported data to NCES in 2014–15, 4,275 (87%) received Carnegie Classifications (IPEDS, n.d.a).
Since its implementation in 1973, and under subsequent revisions and enhancements, the system has become the definitive source of institutional comparison categorization data. This has become increasingly important, as more than 4,000 institutions are classified within the Carnegie Classification system. The Carnegie Classifications allow institutions and researchers to make informed decisions regarding the selection of peer institutions based on analytical groupings of institutions using consistent standards.
The Carnegie Classifications have been revised periodically to reflect changes in higher education, most recently in 2015 (Carnegie, n.d.a). Institutions are categorized based upon data they submit to the Department of Education, the College Board, and the National Science Foundation (McCormick & Zhao, 2005). Carnegie researchers compile the data and classify the institutions based on location, enrollment, programs, and degrees conferred (McCormick & Zhao, 2005). The latest update to the system retained the organizational structure based on the six classifications of institutions implemented in 2005 (discussed in detail in the following paragraphs) but significantly revised the methodology used to classify institutions.
Prior to 2015, the most substantial update to the Carnegie Classification system occurred in 2005, when the structure was revised and the number of categories expanded to make it easier for institutions to identify poten...
Table of contents
Cover
Half Title
Title Page
Copyright Page
Dedication
Table of Contents
List of Figures
List of Tables
Preface
Acknowledgments
Part I Higher Education Institutions and the People in Them
Part II Efficient and Effective Management of Resources
Part III Events and Issues Today that Shape Higher Education
About the Editors
About the Contributors
Index
Frequently asked questions
Yes, you can cancel anytime from the Subscription tab in your account settings on the Perlego website. Your subscription will stay active until the end of your current billing period. Learn how to cancel your subscription
No, books cannot be downloaded as external files, such as PDFs, for use outside of Perlego. However, you can download books within the Perlego app for offline reading on mobile or tablet. Learn how to download books offline
Perlego offers two plans: Essential and Complete
Essential is ideal for learners and professionals who enjoy exploring a wide range of subjects. Access the Essential Library with 800,000+ trusted titles and best-sellers across business, personal growth, and the humanities. Includes unlimited reading time and Standard Read Aloud voice.
Complete: Perfect for advanced learners and researchers needing full, unrestricted access. Unlock 1.5M+ books across hundreds of subjects, including academic and specialized titles. The Complete Plan also includes advanced features like Premium Read Aloud and Research Assistant.
Both plans are available with monthly, semester, or annual billing cycles.
We are an online textbook subscription service, where you can get access to an entire online library for less than the price of a single book per month. With over 1.5 million books across 990+ topics, we’ve got you covered! Learn about our mission
Look out for the read-aloud symbol on your next book to see if you can listen to it. The read-aloud tool reads text aloud for you, highlighting the text as it is being read. You can pause it, speed it up and slow it down. Learn more about Read Aloud
Yes! You can use the Perlego app on both iOS and Android devices to read anytime, anywhere — even offline. Perfect for commutes or when you’re on the go. Please note we cannot support devices running on iOS 13 and Android 7 or earlier. Learn more about using the app
Yes, you can access Organization and Administration in Higher Education by Kristina 'KP' Powers, Patrick J. Schloss, Kristina Powers, Patrick J. Schloss in PDF and/or ePUB format, as well as other popular books in Education & Education General. We have over 1.5 million books available in our catalogue for you to explore.