This book uses spatio-temporal analysis to understand urbanisation in Indian cities and explain the concept and impact of global greenhouse gas (GHG) emissions. It creates a GHG footprint for Indian cities and engages in a discussion about the United Nations Sustainable Development Goals (SDGs) and smart city initiatives within an Indian context. Understanding the spatial patterns of land use/land cover (LULC) dynamics in the rapidly urbanising cities of India, the readers will be able to simulate future urbanisation patterns and use spatial temporal analysis as a tool for implementing appropriate mitigation measures.
Features
Analyses the complete urbanisation and urban sprawl of major cities in India using advanced geospatial modelling techniques
Highlights the best practices and methods used in modelling urban growth
Discusses greenhouse gas emissions from various sectors and their effects in local environments
Addresses the increase of local temperature in cities due to unplanned land use change and its impact on environmental sustainability and resilience
Fills the need for data-driven governance and policy decisions by introducing various analyses through spatial mapping
Highlighting some of the best practices and tools being used for modelling urban growth through case studies, the book is useful to those interested in using new technologies and methods for data collection and problem solving. It focuses on the major environmental issues in India, which are prevalent in most developing countries.
Trusted by 375,005 students
Access to over 1.5 million titles for a fair monthly price.
1.2 Geospatial Approaches in Assessing Landscape Dynamics
1.3 Spatial and Temporal Pattern Assessment of Landscapes
1.4 Land Use Assessment
1.5 Landscape Structure Measurement and Indices
1.6 Land Use Modelling
1.7 Indian Context
1.8 Concluding Remarks
References
1.1 Introduction
Landscape is a mosaic of interacting dynamic ecosystems. The composition of various landscape elements determines the structure of a landscape, which determines the functioning of respective ecosystems. The structure of a landscape, or natural features in a landscape, is influenced either by natural forces or altered by anthropogenic activities. Alterations in the landscape structure vary in terms of size, shape, configuration and arrangement (Antrop, 1998; Turner, 1987). Changes in land use and land cover alter the structure of a landscape and impact the local ecosystem and the global environment (Foley et al., 2005) with gradual or sudden changes in the functional capability of an ecosystem, which affects human lives. Landscape provides a vital link between living organisms and the surrounding environment. Fragmentation of landscape involves the conversion of a single patch into multiple patch types, for instance, conversion of a forest area into a small human settlement followed by agriculture and other land use forms (Saunders et al., 1991; Forman, 1995). Sudhira et al. (2003) outlined the evolution of human settlements from villages to huge megacities. These cities, sometimes also referred to as urban centres, are the result of natural landscapes losing their identity with complex fragmentations. Understanding land use/land cover (LULC) dynamics in a region is essential to assess the level of fragmentation. Land cover (LC) can be defined as the types of physical features present on the earth surface (Lillesand et al., 2012). LC reflects the visible evidence of existing cover pertaining to vegetation and non-vegetation or water and non-water (Ramachandra et al., 2013) on the surface. Land use (LU) is generally referred to as socio-economic utilisation of land due to human activities. It includes exploited land cover types used for industrial, agricultural, plantation, commercial and residential purposes. The alteration of the landscape structure through large-scale land use/land cover change (LULCC) would impact the nutrient, water and biogeochemical cycles directly or indirectly (Ramachandra et al., 2012; Paudel & Yuan, 2012). LULCC is related to anthropogenic activities and affects the biophysics, biogeochemistry and biogeography of the earth’s surface and atmosphere. The effects may be in terms of long wave radiations and violent atmospheric conditions such as changes in heat, water vapour, temperature, carbon dioxide and other trace gases (Kabat et al., 2004; NRC, 2005; Cotton & Pielke, 2007). This necessitates understanding LULCC to formulate appropriate mitigation strategies. Spatial data acquired through space-borne sensors with recent advances in geo-informatics form an overhead perspective at regular intervals (remote sensing data), which help in mapping LULC dynamics.
1.2 Geospatial Approaches in Assessing Landscape Dynamics
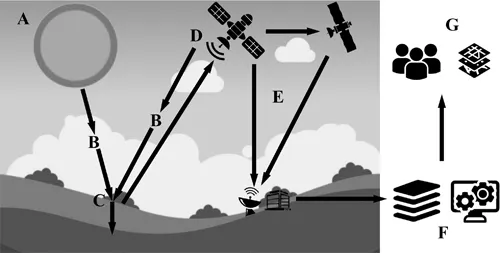
Geographic information system (GIS) and remote sensing techniques are useful in assessing spatial and temporal changes in the landscape, which are essential in regional planning for evolving sustainable management of natural resources to achieve sustainable development (Sudhira et al., 2003). Multi-resolution spatial data of remote sensing has been useful in deciphering spatial and spectral heterogeneity of urban environments (Jensen & Cowen, 1999) and is emerging as one of the best available technique to analyse wider spatial extent. Remote sensing refers to “the science and art of obtaining information about an object, area, or phenomenon through the analysis of data acquired by a device that is not in contact with the object, area or phenomenon under investigation” (Lillesand et al., 2012). The spatial information acquired at regular intervals through sensors mounted in the satellites aids in the inventorying, mapping and monitoring of Earth’s resources. The remote sensing process is governed by seven general steps as indicated in Figure 1.1.
FIGURE 1.1 Remote sensing process. (A) Energy source, the sun (passive remote sensing) or through another source that can transmit its own energy (active remote sensing). (B) Transmission of energy through Earth’s atmosphere. (C) Energy interactions at the earth surface. (D) Energy emitted by the earth surface is recorded by sensors. (E) Generation of raw data (essentially in pictorial or digital format) and communication between satellites and ground stations. (F) Processing, analysis and interpretation of data with the help of computer systems. (G) With the help of GIS, various layers are taken in an ordered fashion to visualise and produce useful data to users.
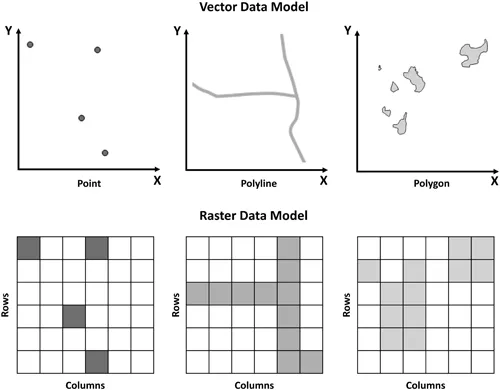
GIS is useful to capture, store, query, analyse and display geospatial data (Chang, 2015). GIS has two major data types: geographic (spatial) and attribute. Spatial data deals with all aspects of location, geometry and shape of the object or area, whereas the attribute data implicates characteristics associated with each of the spatial features. The GIS data model has two major divisions. The first is the vector data model (Figure 1.2), which uses spatial (X, Y) coordinate values (also referred as location coordinates) to construct spatial features (points, lines and areas/polygons). Second, the raster data model uses a collection of grids or pixels (picture elements) to represent the spatial variation of a feature (Figure 1.2).
FIGURE 1.2 Vector and raster data models.
GIS functions include handling and managing spatial and attribute data, displaying and designing maps, data exploration and editing as well as modelling. The ability of GIS to handle and process geospatial data makes GIS distinct from other information systems. GIS has a wide range of applications such as natural resources management, climate change, urban planning, transportation routing, emergency planning, land use change detection and crime analysis. Much of the geoinformatics capability of GIS comes from the database management system (DBMS), which is designed to store and retrieve any kind of attribute data. DBMS involves commands and query languages, for instance SQL. There are various proprietary and open source software programmes available in the market for GIS.
The Global Positioning System (GPS) helps in ascertaining the spatial coordinates (X, Y) of a location, which have immense value in navigation, spatial analyses, etc. GIS and GPS are more or less interdependent on each other. Every point on the earth surface has its own coordinate or XY values. These values can be recorded by a minimum of four communication satellites to give precise location data. The satellites operate at an approximate height of 20,000 kilometres from the earth surface. Many nations have their own positioning systems. For example, Russia has its Global Navigation Satellite System (GLONASS), and most recently India came up with the Indian Regional Navigation Satellite System (IRNSS) aimed to provide accurate location services for military purposes. GPS helps to improve mapping activities by providing ground truth or reference data...
Table of contents
Cover
Half-Title
Title
Copyright
Dedication
Disclaimer
Contents
Preface
Acknowledgements
Authors
1 Landscape Dynamics: An Introduction
2 Quantification of Greenhouse Gas Footprint
3 Land Use and Land Cover Dynamics: Synthesis of Spatio-Temporal Patterns
4 Spatial Metrics: Tool for Understanding Spatial Patterns of Land Use and Land Cover Dynamics
5 Land Use Modelling: Future Research, Directions and Planning
6 Current Trends in Estimation of Land Surface Temperature Using Passive Remote Sensing Data
7 Sustainable Development Goals (SDGs): Disaster Mitigation in Flood-Prone Regions of India
8 Spatial Decision Support System (SDSS) for Urban Planning
Index
Frequently asked questions
Yes, you can cancel anytime from the Subscription tab in your account settings on the Perlego website. Your subscription will stay active until the end of your current billing period. Learn how to cancel your subscription
No, books cannot be downloaded as external files, such as PDFs, for use outside of Perlego. However, you can download books within the Perlego app for offline reading on mobile or tablet. Learn how to download books offline
Perlego offers two plans: Essential and Complete
Essential is ideal for learners and professionals who enjoy exploring a wide range of subjects. Access the Essential Library with 800,000+ trusted titles and best-sellers across business, personal growth, and the humanities. Includes unlimited reading time and Standard Read Aloud voice.
Complete: Perfect for advanced learners and researchers needing full, unrestricted access. Unlock 1.5M+ books across hundreds of subjects, including academic and specialized titles. The Complete Plan also includes advanced features like Premium Read Aloud and Research Assistant.
Both plans are available with monthly, semester, or annual billing cycles.
We are an online textbook subscription service, where you can get access to an entire online library for less than the price of a single book per month. With over 1.5 million books across 990+ topics, we’ve got you covered! Learn about our mission
Look out for the read-aloud symbol on your next book to see if you can listen to it. The read-aloud tool reads text aloud for you, highlighting the text as it is being read. You can pause it, speed it up and slow it down. Learn more about Read Aloud
Yes! You can use the Perlego app on both iOS and Android devices to read anytime, anywhere — even offline. Perfect for commutes or when you’re on the go. Please note we cannot support devices running on iOS 13 and Android 7 or earlier. Learn more about using the app
Yes, you can access Urban Growth Patterns in India by Bharath Aithal, T.V. Ramachandra, Bharath Aithal,T.V. Ramachandra, Bharath H Aithal, T.V. Ramachandra in PDF and/or ePUB format, as well as other popular books in Architecture & Environmental Law. We have over 1.5 million books available in our catalogue for you to explore.