![]()
Chapter 1
Introduction
This is my second book with the intent of sharing my experiences as a management consultant and as an operational practitioner. The focus of this book is optimizing the end-to-end supply chain with an emphasis on supply management, inventory-management, manufacturing execution, and overall supply-chain optimization. I’ve also touched on the importance of business continuity, and I’ve provided some grassroots approaches to identifying risks.
I will be providing insight based on my extensive background of more than 40 years’ experience, but I am not telling you what to do; my hope is that I’ll be giving you a potentially different perspective, which will allow you to consider your situation (objectives and constraints) and then make decisions that fit your purpose.
And the case-in-point examples provide insight to actual real applications of concepts and methodologies. There are 40 case-in-point examples and more than 300 figures (e.g., pictures, diagrams, tables) included in this book.
I have over 27 years’ experience as an industry practitioner and another 13 years as a management consultant. And I think consultants are often perceived in a bad way, but during my days as a consultant, I learned far more about data analytics than I ever did as an industry practitioner. And I take a lot of pride in my direct hands-on manufacturing and supply-chain operations background. But industry practitioners don’t always challenge their perceptions, their legacy-barriers, and so on, and companies are often resistant to going for breakthrough changes. And that’s where I think that companies fail in optimizing their operations, as it’s difficult to break old paradigms because we have a hard time viewing data differently than in very traditional ways.
In this book, I’m going to discuss many analytical tools and methodologies with case-in-point examples for them all. Some may not be new to you, but I suspect that many will be. I have seen many tools and methodologies commonly misapplied, but I think that the case-in-point examples that I have provided will show effective ways to use the tools and methodologies. It should take you from not understanding a tool or methodology to it becoming simple and, basically, common sense for you.
Some of the analytical tools and methodologies that I’ve included are:
- A-B-C Stratifications
- This is a concept that is very often misunderstood and misapplied
- Lean Building Blocks (many are trying, and many are failing)
- Value-Added and Non-Value-Added
- Pure Waste
- Cellular Manufacturing
- Routing-by-Walking-Around
- Spaghetti Diagram
- Yamazumi Chart
- Triple-Play
- Supply Management: Commodity and Spend Analysis
- Kraljic Matrix
- Value Stream Mapping
- Kaizens
- Benefit and effort
- Inventory-Management Systems
- Lean techniques
- Kmax-Kmin Kanban System
- CONWIP System
- WIP Cap
- Manufacturing Execution Strategy
- Rhythm/Pattern Production
- Every-Product-Every-Interval (EPEI)
- Business Continuity
- Oliver Wight Business Excellence Checklist
![]()
Chapter 2
A-B-C Stratification/Applications
Introduction: Pareto and Juran
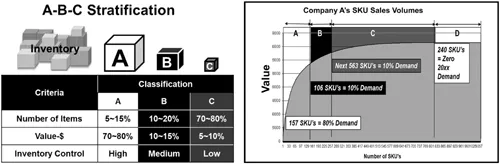
Figure 2.1 displays a couple of the most common applications of A-B-C stratification.
Figure 2.1 A-B-C Stratification.
“A-B-C Stratification” is a methodology that I will repeatedly use throughout this book, as it is an important concept that I find necessary to reference across various supply-chain optimization techniques.
“A-B-C Stratification” is a derivative of the Pareto Principle, which originates from the economic analysis by Vilfredo Pareto in Italy during the early 1900s. He made an observation that 80% of the land in Italy was owned by about 20% of the population, and this later was referred to as the Pareto Distribution. And Pareto hypothesized that this distribution (80–20) would be consistent everywhere and across varied applications, but especially with wealth distribution. And it then began to be known as the “80–20 Rule.” The “80–20 Rule,” basically, means that 80% of the effects come from 20% of the causes.
Some potential examples/applications of the “rule” in supply-chain operations are:
- 20% of a company’s stock keeping units (SKUs) account for 80% of the company’s inventory (value, days-on-hand, demand, etc.)
- 20% of a company’s purchased items (#) equates to 80% of the company’s total spend ($)
- 80% of your output is the result of 20% of your actions (inputs)
- 80% of a company’s revenue is derived from 20% of the company’s product
- 80% of a company’s defects are created on 20% of the company’s product
In 1937, Dr. Joseph Juran ultimately conceptualized the Pareto Principle based on Vilfredo Pareto’s earlier works, and Juran used this as a management principle to get folks to separate the “vital few” from the trivial many.” There have been recent movements to officially change the Pareto Principle to the Juran Principle, as Juran, surely, changed the applicability of the principle from an often-misused/misunderstood generalizing principle to a quality or management technique of simply focusing on the vital few, i.e., deciding what has the biggest impact and focusing on that rather than being distracted by the many other things that have a far lesser impact. But as you decide on what’s vital, Juran was also a firm believer in making your decisions based on data, not “feelings.” Juran has, famously, been cited for having once showed a cla...