![]()
1
Methane Sources and the Global Methane Budget
Dave Reay, Pete Smith and André van Amstel
Introduction
When the late-18th-century Italian physicist Alessandro Volta first identified methane (CH4) as being the flammable gas in the bubbles that rose from a waterlogged marsh, he could not have guessed how important this gas would prove to be to human society in the centuries that followed. Today CH4 is used throughout the world as both an industrial and domestic fuel source. Its exploitation has helped drive sustained economic development and it has long provided a lower-carbon energy alternative to coal and oil. As an energy source it remains highly attractive and much sought after; indeed, energy from CH4 (in the form of natural gas) has played a major role in the UK meeting its Kyoto Protocol commitments to reduce greenhouse gas emissions by allowing a switch from coal firing of power stations to gas firing. However, CH4 is now increasingly being considered as a leading greenhouse gas in its own right.
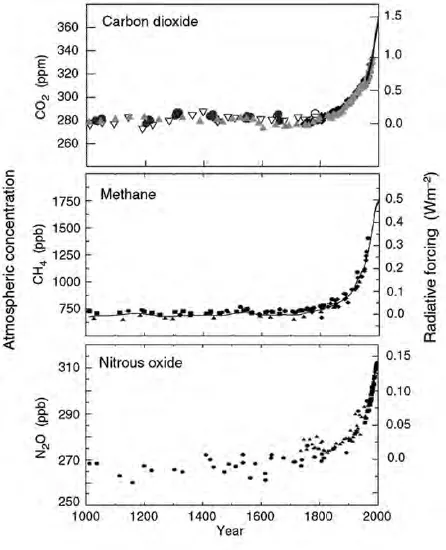
At the time that Volta was collecting his bubbles of marsh-gas, CH4 concentrations in the atmosphere stood at around 750 parts per billion (ppb) and it was almost a century later that John Tyndall demonstrated its powerful infrared absorption properties and its role as a greenhouse gas. Like the other two main anthropogenic greenhouse gases – carbon dioxide (CO2) and nitrous oxide (N2O) – the concentration of CH4 in the atmosphere has increased rapidly since pre-industrial times. Ice core records, and more recently atmospheric samples, show that since the beginning of the industrial era concentrations have more than doubled to their current high of over 1750 ppb (Figure 1.1). This concentration far exceeds the maximum concentration of CH4 in the atmosphere at any time in the preceding 650,000 years, and is estimated to be resulting in an additional radiative forcing of about 0.5 watts per metre squared compared to the level in 1750.
Figure 1.1 Atmospheric concentrations of carbon dioxide, methane and nitrous oxide over the last 1000 years
Source: Reproduced with permission from the Intergovernmental Panel on Climate Change.
Though these concentrations are much lower than those of CO2 (currently ~386 parts per million – ppm), CH4 is more effective at absorbing and reemitting infrared radiation (heat). Indeed, the global warming potential (GWP) of CH4 on a mass basis is 25 times that of CO2 over a 100-year time horizon (see Box 1.1).
Box 1.1 Global warming potential
GWP compares the direct climate forcing of different greenhouse gases relative to that of CO2. The GWP combines the capacity of a gas to absorb infrared radiation, its lifetime in the atmosphere, and the length of time over which its effects on the earth’s climate need to be quantified (the time horizon). In the case of CH4 it is also adjusted to take account of indirect effects via the enhancement of tropospheric ozone, stratospheric water vapour and production of CO2 resulting from its destruction in the atmosphere. So, as CH4 has an effective climate-forcing lifetime in the atmosphere of only 12 years, CH4 has a GWP of 72 over a 20-year time horizon, but a GWP of 25 over a 100-year time horizon and 7.6 over a 500-year time horizon.
The GWP figures for CH4 provided in Box 1.1 represent the latest provided by the Intergovernmental Panel on Climate Change (IPCC) in its Fourth Assessment Report (IPCC, 2007). However, these values have varied between the different reports based on improved understanding of atmospheric lifetimes and indirect effects. As such, slightly lower values of GWP for CH4 are often to be found in the literature, with the GWP of 21 for CH4 over a 100-year time horizon provided in the Second Assessment Report (IPCC, 1995) being very widely used and forming the basis for most national greenhouse gas budget reporting and trading. Throughout this book we therefore default to the 100-year GWP of 21 provided in the Second Assessment Report, unless otherwise stated.
Box 1.2 Carbon dioxide equivalents
When attempting to assess the relative importance of CH4 fluxes and mitigation strategies the concept of carbon dioxide equivalents (CO2-eq) is often employed to convert CH4 fluxes into units directly comparable with CO2. This is done simply by multiplying the mass of CH4 by its GWP to give the mass in CO2-eq. Usually the 100-year time horizon GWP value (for example 21 or 25) is used, so a reduction of 1 tonne of CH4 would be a reduction of 21 or 25 tonnes CO2-eq respectively. However, where a shorter time horizon is considered, the GWP increases substantially, a reduction of 1 tonne of CH4 using a 20-year GWP time horizon yielding a cut of 72 tonnes of CO2-eq. A 100-year time horizon has become the commonly used benchmark for national greenhouse gas emissions budgets and trading.
During the 1990s and the first few years of the 21st century the growth rate of CH4 concentrations in the atmosphere slowed to almost zero, but during 2007 and 2008 concentrations increased once again. Recent studies have attributed this new increase to enhanced emissions of CH4 in the Arctic as a result of high temperatures in 2007, and to greater rainfall in the tropics in 2008 (Dlugokencky et al, 2009). The former response represents a snapshot of a potentially very large positive climate change feedback, with the higher temperatures projected at high latitudes for the 21st century increasing CH4 emissions from wetlands, permafrosts and CH4 hydrates. It is to this and the myriad other natural and anthropogenic determinants of CH4 flux to the atmosphere that this book is directed.
Though CO2 emissions and their mitigation still dominate much of climate change research and policy, recent years have seen increasing recognition that reducing CH4 emissions may often provide a more efficient and cost-effective means to mitigate anthropogenic climate change. In addition, current projections of greenhouse gas concentrations and resultant climate forcing in the 21st century require an improved understanding of how natural CH4 sources will respond to changes in climate. Our aim, therefore, is to provide a synthesis of the current scientific understanding of the major sources of CH4 around the planet and, where appropriate, to consider how these emissions may change in response to projected climate change. We then focus on the range of CH4 emission mitigation strategies currently at our disposal and examine the extent to which these can be employed in future decades as part of national and international efforts to address anthropogenic climate change.
The global methane budget
The global CH4 budget is composed of a wide range of sources (see Table 1.1 and also Figure 4.5 in Chapter 4) balanced by a much smaller number of sinks, any imbalance in these sources and sinks resulting in a change in the atmospheric concentration. There are three main sinks for CH4 emitted into the atmosphere, with the destruction of CH4 by hydroxyl (OH) radicals in the troposphere being the dominant one. This process also contributes to the production of peroxy radicals, and it is this that can subsequently lead to the formation of ozone and so induce a further indirect climate-forcing effect of CH4 in the atmosphere. In addition this reaction with OH radicals reduces the overall oxidizing capacity of the atmosphere – extending the atmospheric lifetime of other CH4 molecules – and produces CO2 and water vapour. Each year an estimated 429–507Tg (teragram; 1Tg = 1 million tonnes) of CH4 are removed from the atmosphere in this way.
The other sinks are much smaller, with ~40Tg CH4 removed each year by reaction with OH radicals in the stratosphere, and ~30Tg CH4 removed by CH4-oxidizing bacteria (methanotrophs) in soils that use the CH4 as a source of carbon and energy. A relatively small amount of CH4 is also removed from the atmosphere through chemical oxidation by chlorine in the air and in the surface waters of our seas. Though several chapters within this book refer to the global CH4 sinks in terms of their impact on net CH4 emissions – in particular the soil CH4 sink – the focus of this book is on the sources of methane, their determinants and their mitigation. Detailed reviews of the key CH4 sinks and their role globally can be found in Cicerone and Oremland (1988), Crutzen (1991) and Reay et al (2007).
Table 1.1 Global estimates of methane sources and sinks
| Natural sources | Methane flux (Tg CH4 yr–1)a | Rangeb |
| Wetlands | 174 | 100–231 |
| Termites | 22 | 20–29 |
| Oceans | 10 | 4–15 |
| Hydrates | 5 | 4–5 |
| Geological | 9 | 4–14 |
| Wild animals | 15 | 15 |
| Wild fires | 3 | 2–5 |
| Total (natural) | 238 | 149–319 |
| Anthropogenic sources |
| Coal mining | 36 | 30–46 |
| Gas, oil, industry | 61 | 52–68 |
| Landfills and waste | 54 | 35–69 |
| Ruminants | 84 | 76–92 |
| Rice agriculture | 54 | 31–83 |
| Biomass burning | 47 | 14–88 |
| Total, anthropogenic | 336 | 238–446 |
| Total, all sources (AR4)c | 574 (582) | 387–765 |
| Sinks |
| Soils | –30 | 26–34 |
| Tropospheric OH | – 467 | 428–507 |
| Stratospheric loss | –39 | 30–45 |
| Total sinks (AR4) | –536 (581) | 484–586 |
| Imbalance (AR4) | 38 (1) | –199–281 |
Note: a Values represent the mean of those provided in Denman et al (2007, Table 7.6) rounded to the nearest whole number. They draw on eight separate studies, with base years spanning the period 1983–2001. b Range is derived from values given in Denman et al (2007, Table 7.6). Values from Chen and Prinn (2006) for anthropogenic sources are not included due to overlaps between source sectors. c Values in parentheses denote those provided in the IPCC Fourth Assessment Report (AR4) as the ‘best estimates’ for the period 2000–2004. Source: Values derived from Denman et al (2007)
Of the many significant sources of CH4 on a global scale, both natural and anthropogenic, the bulk have a common basis – that of microbial methanogenesis. Though CH4 from biomass burning, vegetation and geological or fossil fuel sources may be largely non-microbial in nature, understanding the processes that underpin microbially mediated CH4 fluxes is central to quantifying and, potentially, reducing emissions from all other major sources. In Chapter 2 ‘The Microbiology of Methanogenesis’, Fons Stams and Caroline Plugge review our current understanding of microbial methano-genesis and the interactions between different microbial communities that result in the bulk of CH4 emissions to the global atmosphere.
Natural sources
Major natural sources i...