Here is a thoughtful new book for professionals who assist persons afflicted with neuromuscular disorders to help them and their families adapt to lifestyle changes accompanying the onset of these disorders. Health care professionals provide strategies to maintain the psychosocial well-being of children and adults with neuromuscular disorders which, in addition to physical damage, also assault the sense of self and challenge the individual's ability to move and communicate. Chapters describe the psychosocial aspects of a variety of neuromuscular diseases such as Duchenne and myotonic muscular dystrophy, multiple sclerosis, amyotrophic lateral sclerosis, Friedeich's ataxia, and Charcot-Marie-Tooth disease. The distinctive characteristics of each disease are examined with special attention given to the natural history, treatment, management, and psychosocial issues of the specific disorder. Beyond the clinical and research importance of Muscular Dystrophy and Other Neuromuscular Diseases, it also addresses the anxiety, doubts, and questions felt by patients with chronic progressive disabilities and their families. This helpful guide is unique in the way it features the interaction of professionals in the social services, psychology, religion, and various medical specialties in the care and treatment of these patients. Professionals in all of these disciplines, as well as the patients and families afflicted by these disorders, will benefit from this valuable resource.
eBook - ePub
Muscular Dystrophy and Other Neuromuscular Diseases
Psychosocial Issues
- 264 pages
- English
- ePUB (mobile friendly)
- Available on iOS & Android
eBook - ePub
Muscular Dystrophy and Other Neuromuscular Diseases
Psychosocial Issues
About this book
Trusted by 375,005 students
Access to over 1.5 million titles for a fair monthly price.
Study more efficiently using our study tools.
Information
Topic
MedicineSubtopic
Anesthesiology & Pain ManagementSECTION I: PSYCHOSOCIAL ASPECTS OF NEUROMUSCULAR DISORDERS
Impact of Illness on Lifestyle
Lisa B. Schwartz, MD, is affiliated with the Department of Neurology; Patricia A. Devine, MD, is affiliated with the Neuromuscular Clinic; Clyde B. Schechter, MD, is Assistant Professor of Community Medicine; and Adam N. Bender, MD, is Associate Professor of Neurology and Director of the Neuromuscular Clinic and Laboratory, all at Mount Sinai Hospital and Medical Center, New York, NY 10029.
This work was submitted in partial fulfillment of the clerkship requirements in Community Medicine while Patricia Devine and Lisa Schwartz were third-year students at Mount Sinai School of Medicine.
The authors wish to thank Virginia Walther, CSW, for help with this investigation.
The percentage of our population with chronic and terminal illness is on the rise, largely due to increasing numbers of elderly and advances in medical technology and chemotherapy (Forsyth, Delaney, and Gresham 1984; Wilson and Drury 1984). Cost containment is now a major issue in the health arena, causing a shift in treatment from long-term hospital stays to ambulatory care. As a result, there is a need to reevaluate whether the psychosocial needs of the chronically and terminally ill are being met within this changing system.
The purpose of this study is to explore the similarities and differences between patients with myasthenia gravis (MG), a chronic disease, and amyotrophic lateral sclerosis (ALS), a terminal disease. Both are neuromuscular diseases characterized by muscle weakness, and both can lead to difficulty in talking and swallowing as well as to difficulty in breathing, life on a respirator, and death (Muscular Dystrophy Association 1984, 1986; Myasthenia Gravis Foundation 1985; Sivak, Gipson, and Hanson 1982; Charles 1985). The similarity of these two diseases led Mulder, Lambert and Eaton in 1959 to address the issue of confusion of the two diagnoses in their article “Myasthenic Syndrome in Patients with Amyotrophic Lateral Sclerosis.” This internal consistency makes these two diseases ideal in studying the larger hypothesis since MG is treatable and ALS is not.
MG is an autoimmune disease caused by a reduction in the number of functioning acetylcholine receptors in the muscle endplate (Myasthenia Gravis Foundation 1985, 1986). This causes abnormal neuromuscular transmission and results in voluntary muscle fatigue, ptosis, and diplopia. It most commonly affects women of childbearing age and men in their fifth decade (Myasthenia Gravis Foundation 1985). The treatment of MG includes anticholinesterase agents, thymectomy, steroids and other immunosuppressive drugs, and plasmapheresis (Muscular Dystrophy Association 1986; Myasthenia Gravis Foundation 1986).
ALS is a disease cf unknown etiology in which the upper and lower motor neurons gradually disintegrate, resulting in progressive atrophy of the muscle cells they innervate (Muscular Dystrophy Association 1984). Muscular atrophy, paralysis, fasciculations, hyperreflexia, emotional incontinence, and relentless progression are characteristic (Myasthenia Gravis Foundation 1985; Udaka et al. 1984). It occurs more commonly in men (1.5 male: 1.0 female) with the average age of onset 57 years old. Fifty percent of all ALS patients die within three years of onset (Janiszewski, Caroscio, and Wisham 1983).
METHODS
In order to evaluate the differences in the impact on lifestyle of a treatable diagnosis versus an untreatable one, a cross-sectional survey design was utilized. The study population was composed of 19 ALS and 19 MG patients from the respective clinics at Mount Sinai Medical Center, which is a national center for ALS and a regional center for MG. Twenty-two questionnaires were distributed to ALS patients and 20 to MG patients; 39 were completed for a response rate of 93%. Three ALS patients dropped out.
Almost all the instruments in this study have already been used and extensively pretested where their validity and reliability have been established (Wallston et al. 1976; Billings and Moos 1981; Brown, Rawlinson, and Hilles 1981; Schipper and Levitt 1985; Spitzer et al. 1981). The survey form contained a total of eight sections of fill-in, multiple choice and yes/no questions:
1. Demographics. This included date of birth, sex, race, marital status, education, occupation, income, and date of diagnosis.
2. Severity of Illness. The patient rated his concept of illness severity as compared to the physician’s assessment. Swallowing and breathing difficulties were included because these are common manifestations of very advanced stages in both illnesses.
3. Coping Styles. This was adapted from the Billings and Moos (1981) coping response items. Included are three methods of coping and two foci of coping categories. Coping methods consisted of active cognitive (AC) coping (6 items), including attempts to manage one’s appraisal of the stressfulness of the event; active behavioral (AB) coping (6 items), referring to overt behavioral attempts to deal directly with the problem and its effects; and avoidance coping (5 items), referring to attempts to avoid actively confronting the problem or to indirectly reduce emotional tension by eating or smoking more. Coping foci consisted of problem-focused (PF) coping (6 items), including attempts to modify or eliminate the sources of stress through one’s own behavior; and emotion-focused (EF) coping (11 items), including behavioral or cognitive responses whose primary function is to manage the emotional consequences of stressors and to help maintain one’s emotional equilibrium (Billings and Moos 1981).
4. Life Satisfaction, Perceived Health and Social Activity. Brown et al. (1981) proposed a life satisfaction model where they compared coronary artery disease with chronic obstructive pulmonary disease patients. Life satisfaction, perceived health, and social activity were each measured by a 9-Rung Cantril Ladder, which is an equal-interval, self-anchoring scale.
5. Multidimensional Health Locus of Control (MHLC). MHLC is an 18-item Likert-type instrument developed by Wallston et al. and based on Rotter’s social learning theory (Wallston et al. 1976; Wallston and Wallston 1978). It consists of subscales reflecting three dimensions: whether the patients think (1) they have control over their health (internal LOC); (2) their health is determined by powerful others (external LOC); or (3) their health is a matter of luck (chance LOC). Items are scored on a six-point scale and answers are totaled as three separate scores (McFarlane et al. 1980).
6. Psychosocial Well-Being. This section explored social life, family relations, friendships, recreation, religious activities, and psychological well-being. Seven out of the 14 questions (4, 5, 10, 11, 12, 13 and 14) were adapted from the Functional Living Index for Cancer (FLIC) (Schipper and Levitt 1985) (see Table 1). FLIC is a 22-item survey that utilizes the Likert Scale. The polarities of the questions were alternated in FLIC. We modified this by arranging all negative polarities on the left side and positive polarities on the right side since Corney and Clare’s (1985) pilot study on the Social Problem Questionnaire showed that alternating directions causes confusion. Questions 6, 7 and 8 were adapted from Ware, who emphasized the importance of social factors in conceptualizing disease impact (Ware 1984; Holahan and Moos 1981). Questions 2, 3 and 9 were innovative questions.
7. Public and Body Image. This section examined distorted body image and lack of privacy, two changes often found in chronic and terminal illness according to Purtilo (1976). It consisted of three yes/no questions: (1) Since the diagnosis, do you ever find yourself hesitating to look in the mirror? (2) When you go out in public, do you feel like people are staring at you? and (3) If yes, has this caused you to avoid public places? The last two questions compared type of diagnosis and public image.
8. Quality of Life (QOL). QOL of the two groups was compared by using the “Q-L INDEX” developed by Spitzer et al. (1981). The Q-L INDEX consists of five distinct item groups including activity, daily living, health, support, and outlook. Each item is scored on a 0–2; point scale giving a total score of 0–10.
RESULTS
The mean age was greater for ALS (61.91) than for MG (53.59) whereas the standard deviation was greater for MG than for ALS patients (Table 2). This age difference was taken into account in the analysis by comparing age-specific scores of the 15 MG patients 40 years old or older with the ALS group for all lifestyle variables. A younger subgroup could not be compared since a younger age group did not exist for ALS. There were also some discrepancies in the distribution of perceived illness severity between the two groups (Table 3). There was a small subgroup that regarded their illness as mild, and they were equally represented in the two diseases. Ratios of moderate and advanced were reversed in the two groups, and for this reason moderate and severe patients were compared separately. Some differences were noted in sex and years since diagnosis (Table 2). The ratio of males to females in MG was 0.46 whereas it was 1.11 in ALS. For this reason, the data was reanalyzed to control for sex by comparing sex-specific scores for all lifestyle variables. The mean number of years since diagnosis was greater for MG (Table 2). This could not be controlled for since there were only six MG patients in contrast to 18 ALS patients that were diagnosed five years ago or less. Race, marital status, income, and education were distributed relatively equally between the two groups (Tables 4–7). There was no relationship between the type of diagnosis and changes in employment status by Chi Square Analysis (X2 = 0.786, X2 = 1.39; NS).
Table 1 PSYCHOSOCIAL WELL-BEING
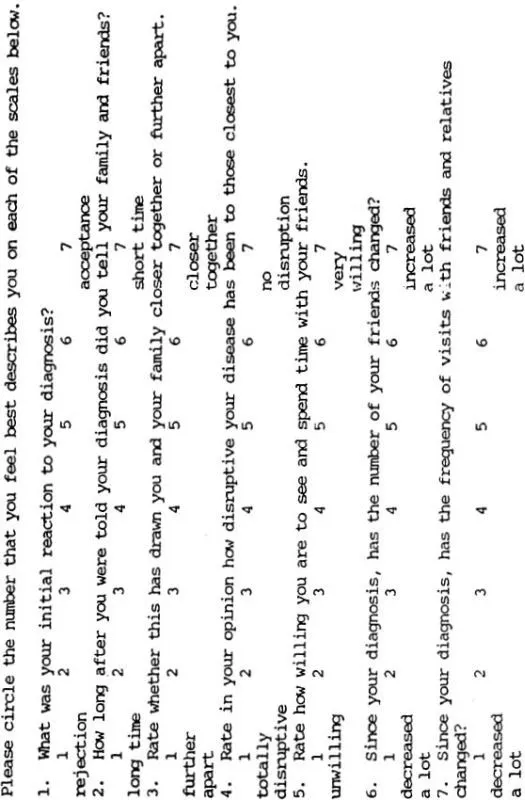
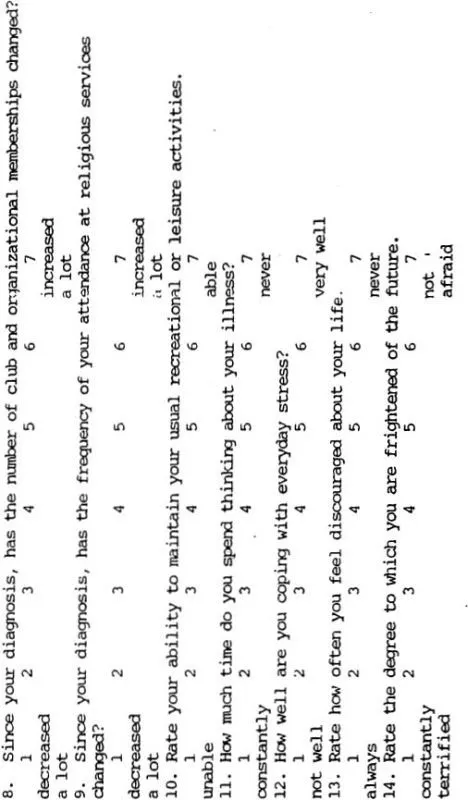
TABLE 2 – AGE, SEX AND NUMBER OF YEARS SINCE DIAGNOSIS

TABLE 3 – PERCEIVED ILLNESS SEVERITY (%)
EARLY | MODERATE | ADVANCED | |
ALS | 15.8(3) | 31.6(6) | 52.6(10) |
MG | 15.8(3) | 52.6(10) | 31.6(6) |
Coping styles used by the two groups revealed a mean AC score that was greater for MG (68.40) than ALS (60.52) and a mean AB score that was greater for ALS (86.84) than MG (67.53). However, only the AB c...
Table of contents
- Cover
- Half Title
- Title Page
- Copyright Page
- Table of Contents
- Preface
- SECTION I: PSYCHOSOCIAL ASPECTS OF NEUROMUSCULAR DISORDERS
- SECTION II: CLINICAL AND RESEARCH CONSIDERATIONS
- SECTION III: IMPORTANCE OF SOCIAL SUPPORT
Frequently asked questions
Yes, you can cancel anytime from the Subscription tab in your account settings on the Perlego website. Your subscription will stay active until the end of your current billing period. Learn how to cancel your subscription
No, books cannot be downloaded as external files, such as PDFs, for use outside of Perlego. However, you can download books within the Perlego app for offline reading on mobile or tablet. Learn how to download books offline
Perlego offers two plans: Essential and Complete
- Essential is ideal for learners and professionals who enjoy exploring a wide range of subjects. Access the Essential Library with 800,000+ trusted titles and best-sellers across business, personal growth, and the humanities. Includes unlimited reading time and Standard Read Aloud voice.
- Complete: Perfect for advanced learners and researchers needing full, unrestricted access. Unlock 1.5M+ books across hundreds of subjects, including academic and specialized titles. The Complete Plan also includes advanced features like Premium Read Aloud and Research Assistant.
We are an online textbook subscription service, where you can get access to an entire online library for less than the price of a single book per month. With over 1.5 million books across 990+ topics, we’ve got you covered! Learn about our mission
Look out for the read-aloud symbol on your next book to see if you can listen to it. The read-aloud tool reads text aloud for you, highlighting the text as it is being read. You can pause it, speed it up and slow it down. Learn more about Read Aloud
Yes! You can use the Perlego app on both iOS and Android devices to read anytime, anywhere — even offline. Perfect for commutes or when you’re on the go.
Please note we cannot support devices running on iOS 13 and Android 7 or earlier. Learn more about using the app
Please note we cannot support devices running on iOS 13 and Android 7 or earlier. Learn more about using the app
Yes, you can access Muscular Dystrophy and Other Neuromuscular Diseases by Leon I. Charash,Robert E. Lovelace,Leach F. Claire,Kutscher H. Austin,Goldberg Jacob,Roye, P. David in PDF and/or ePUB format, as well as other popular books in Medicine & Anesthesiology & Pain Management. We have over 1.5 million books available in our catalogue for you to explore.