![]()
1.1 Introductory Remarks
Desalination is gaining popularity as an alternative water supply resource as many municipalities and utilities worldwide are facing increasing population growth pressures, shortage of suitable local water resources, and more stringent water quality regulations. Until recently, use of seawater desalination was limited to desert-climate dominated regions. Recent technological advances and associated decreases in water production costs and energy demand have expanded use of desalination in coastal areas traditionally supplied with fresh water resources (Bazargan, 2018; Gude, 2018).
At present, more than 19,000 desalination plants worldwide produce a total of 99.8 million cubic meters per day (m3/day) of fresh water from seawater and brackish water (GWI, 2017) and provide approximately 1% of the world’s drinking water supply. The number and size of desalination projects worldwide have been growing at a rate of 5%–6% per year since 2010, which corresponds to an addition of 3.0–4.0 million m3/day of newly installed desalination plant fresh water production capacity every year.
This growth is due to a number of long-term global trends including: (1) steadily increasing population growth and associated demand for fresh drinking water in urbanized coastal areas; (2) prolonged drought in the arid and semi-arid coastal areas of the world; and (3) limited availability of untapped traditional low-cost fresh water resources in these areas. Arid and semi-arid coastal zones of the world are inhabited by over 70% of the world’s population and are usually the fastest growing and most urbanized areas.
In total, 18% of the existing desalination plants are large size (i.e., have fresh water production capacity of over 100,000 m3/day) and 36% are medium size (i.e., have a production capacity of 10,000–100,000 m3/day). Medium and large size plants contribute approximately 90% (86 million m3/day) of the existing total installed desalination plant capacity worldwide.
A clear recent trend in seawater desalination is the construction of larger capacity plants, which deliver an increasingly greater portion of the fresh water supply of coastal cities around the globe. While most of the large desalination plants built between 2000 and 2010 were typically designed to supply only 5%–10% of the drinking water of large coastal urban centers, today most regional or national desalination project programs in countries such as Spain, Australia, Israel, Algeria, and Singapore aim to secure 25%–30% of their long-term drinking water needs with desalinated seawater.
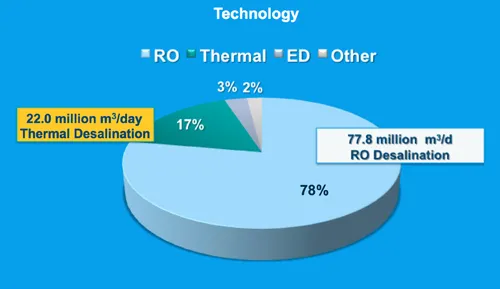
In the next 5 years, the largest investments in new desalination projects are projected to occur in the Middle East and North Africa (US$28.2 billion), East Asia and the Pacific (US$9.6 billion), North America (US$5.1 billion), Latin America/Caribbean (US$4.9 billion), and Western Europe (US$2.9 billion) (GWI, 2017). Since 2010, reverse osmosis (RO) desalination has been the main technology of choice for production of fresh water from saline water worldwide (Figure 1.1).
FIGURE 1.1 Breakdown of installed desalination plants worldwide by technology (2017).
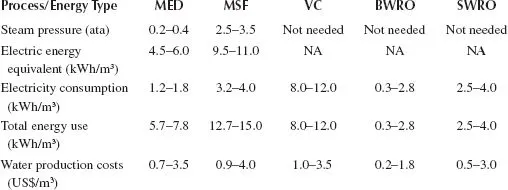
The prevalence of this desalination technology is due to the fact that for most saline sources and applications worldwide, it yields fresh water at overall energy use and costs lower than those of thermal desalination technologies such as multi-effect distillation (MED) and multi-stage flash distillation (MSF) – see Table 1.1.
TABLE 1.1
Energy and Water Production Costs for Alternative Desalination Technologies
Note: NA – Not applicable.
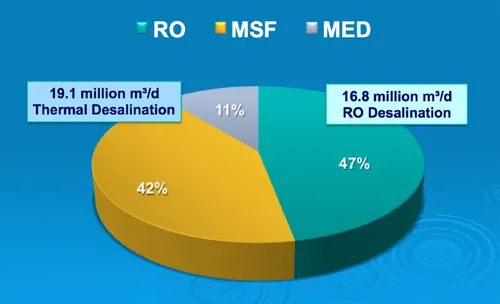
At present, over 50% of the existing desalination plants are located in the Middle East and North Africa (MENA) region. The majority of the plants built in this region over the past 5 years employ seawater RO (SWRO) membrane desalination (Figure 1.2) for production of fresh water. The steady trend of increasing use of SWRO membrane desalination in the MENA region is mainly attributed to the lower energy use, high efficiency, and lower fresh water production costs associated with this technology as compared to thermal desalination (Ghaffour et al., 2013; Loutatidou et al., 2014).
FIGURE 1.2 Breakdown of installed desalination plants in MENA by technology (2017).
The decline of thermal desalination is reflected in the recent decision of Saudi Arabia’s government not to build any MSF plants in the future, after the construction of the largest hybrid (MSF and SWRO) desalination plant in the world in Ras Al-Khair (WDR, 2017). This facility incorporates a 727,000 m3/day MSF plant and 310,000 m3/day SWRO plant. A similar trend toward preferential use of SWRO desalination technology for future projects is observed in other Middle Eastern countries such as Oman, Qatar, and the United Arab Emirates as well as in most countries in North Africa (Caldera and Breyer, 2017; Shazhad et al., 2017).
Source water salinity is one of the most important factors determining desalination project design and costs (AWWA, 2007; Papapetrou et al., 2017). Based on the salinity of the source water they process, desalination plants can be divided into three broad categories: low-salinity and high-salinity brackish water desalination plants, and seawater desalination plants.
Low-salinity brackish water (BW) desalination plants often have a relatively simple single-stage RO system configuration and are typically designed to treat water of total dissolved solids (TDS) concentration between 500 and 2,500 mg/L. For such plants, it is common that 5%–30% of the source water flow is bypassed and blended with permeate produced by the RO system. Therefore, such facilities are relatively less costly to build and operate.
Depending on the target water quality and method of concentrate disposal, low-salinity BWRO plants may employ more than one RO stage in order to reduce concentrate volume and costs. For example, the majority of the BWRO plants in Florida and Texas are low-salinity groundwater desalination plants. It should be pointed out that the low-salinity surface water BWRO plants usually produce desalinated water at 10%–20% higher cost, usually because of the more costly and complex pretreatment.
High-salinity BWRO plants are configured to process brackish source waters with TDS content in a range of 2,500–10,000 mg/L, usually treat the entire source water flow, and as a minimum incorporate a two-stage RO system. Typically, fresh water production costs of high-salinity desalination plants are 15%–35% higher than those of low-salinity desalination projects. The main cost differences originate from the higher energy use associated with the elevated source water salinity, the more complex RO system configuration, and the lower fresh water recovery at which such plants typically operate.
Seawater desalination projects are designed to process source water of salinity between 15,000 and 46,000 mg/L. Usually such plants are configured as multi-pass, multi-stage RO systems, which operate at significantly lower recoveries and have higher energy use than brackish water desalination plants. In addition, SWRO membrane elements and vessels are more costly because they are designed to withstand higher pressures. As a result, the costs for desalinating seawater are usually measurably higher than those for producing the same quality of fresh water by brackish water desalination.
Depending on the target product water quality and site-specific conditions such as energy costs and concentration of other source water constituents besides sodium and chloride, saline waters of TDS concentration between 10,000 and 15,000 mg/L could be processed by both seawater and brackish water desalination systems.
While brackish water desalination plants are less costly to build and operate, often brackish water sources are not readily available and usually are fairly limited in volume and extraction rate. Seawater reverse osmosis desalination is the most widely used membrane salt separation technology at present, because it allows tapping into the largest natural source of water on the planet – the seawater contained in the oceans and seas.
Approximately 75% (1.6 million m3/day) of the new globally installed desalination plant capacity for the period of June 2016 to July 2017 (2.14 million m3/day) was for seawater desalination and only 15% (0.32 million m3/day) was for brackish water desalination (GWI, 2017). The remaining 10% (0.32 million m3/day) of the desalination plants have applied other water treatment tech...