- 278 pages
- English
- ePUB (mobile friendly)
- Available on iOS & Android
eBook - ePub
Electronic Databases and Publishing
About this book
The true pioneers in electronic publishing put their bibliographic databases on tape and online in the 1960s. Nearly all of them had long experience with compiling information for distribution in printed form and a strong market connection. As a result of Soviet advances in science and space technology, American government support for information science and academic libraries flowed freely for a little over a decade, making possible tremendous advances in technology, in retrieval techniques and in sophisticated coverage. Advances in information technology and market conditions have encouraged many more participants to underwrite the development of databases that now extend into the arts, social sciences, business, and popular interests. These essays show how production statistics accompanied by statements of editorial coverage provide a fairly accurate reflection of output of many of the major disciplinary bibliographic databases. The urgent priority of information resources in the 1960s has encouraged comprehensive servicing of the formal research literature as published in journals and monographs. Authors have counted subject words, languages, origins, types of publication, and so on over several decades. This volume also includes articles on some databases that are not strictly bibliographic, such as the CMG database of college courses, which illuminates some of the changes in college textbook publishing. Information seekers will find the many tables of practical use, as guidance to what and how much may be found within each database. Analysts of publishing, of science policy, and of higher education will find information relevant to expenditures, human resources, and other indicators of education, research, and technology activity.
Trusted by 375,005 students
Access to over 1.5 million titles for a fair monthly price.
Study more efficiently using our study tools.
Information
1
Database Publishing Statistics
Martha E. Williams
Database statistics have been a long-standing interest of mine because of their relationship to the conversion of traditional abstracting and indexing journals from paper-based products to electronic computer-readable databases. In the late 1960s, in order to keep track of databases as they became publicly available, I began collecting literature about bibliographic databases. By 1973 I had sufficient information to warrant developing a directory of data about databases wherein the same types of data about the different databases would be collected to permit comparisons on the same bases. In 1974 I founded and edited the first edition of Computer-Readable Databases (CRDB) and offered it to the American Society for Information Science for publication. (See Williams & Rouse 1976.) I continued to edit and produce the camera-ready copy of CRDB for a sequence of publishers over the years (American Society for Information Science; Knowledge Industry Publications, Inc.; American Library Association; and its copublisher in Europe for CRDB, Elsevier Science Publishers) and published database statistics in those volumes. In 1987 CRDB was acquired by Gale Research, Inc. For several years Gale published CRDB with Kathleen Young Marcaccio as editor and with Martha E. Williams as founding editor. In the latter capacity I analyzed the database data collected by Gale and produced an annual article entitled "The State of Databases Today" (see e.g., Williams 1995 c), which Gale published as the foreword to the directory. In 1993 Gale ceased publishing the CRDB per se and merged it with two other directories. The Gale Directory of Databases was formed in 1993 by the merger of three database directories acquired by Gale Research, Inc.: Computer-Readable Databases, founded by editor Martha E. Williams in 1975 and acquired by Gale in 1987; The Directory of Online Databases, founded by Cuadra Associates in 1979 and acquired by Gale in 1992; and The Directory of Portable Databases, founded by Cuadra/Elsevier in 1990 and acquired by Gale in 1992. The Gale Directory of Databases is published twice a year in two volumes (see Nolan 1995). The statistics presented herein are based on the analyses I do for Gale Research of data published in the GDD plus data from the Information Market Indicator Reports (IMI Reports).
Data cover the worldwide database industry and are independent of the media in which databases are distributed and accessed. To maintain continuity with prior database statistics and to build a continuing comprehensive set of comparable database statistics, entries are coded by Gale specifically for my analyses even though these special codes do not appear in print. The statistics indicate the growth of the database industry as represented by the increase in number of database records, online searches, databases, database entries in GDD, database producers, and database vendors. I look at databases in terms of geographic region and producer status where producer status refers to the societal sector of origin—Government; Commerce/Industry (for-profit); Not-For-Profit (NFP), which includes Academe; and Mixed sectors. I also consider databases in terms of the form or representation of the data, the subject matter or intellectual content of the data in the database, and the medium for access and/or distribution. Data relative to early years, and some of the current data are taken from some of my other publications and are also included in the "State of Databases Today" articles. Because of page limitations, I include here a brief snapshot of the major statistics about databases over the twenty-year period 1975–1994.
Databases
Databases are characterized as word-oriented, number-oriented, and also, in more recent years with the introduction of multimedia technology, as audio (for databases including sound data), image (for databases including pictorial or graphic data), and video (for moving picture data). Some data are worldwide and some are for the United States only and are noted as such.
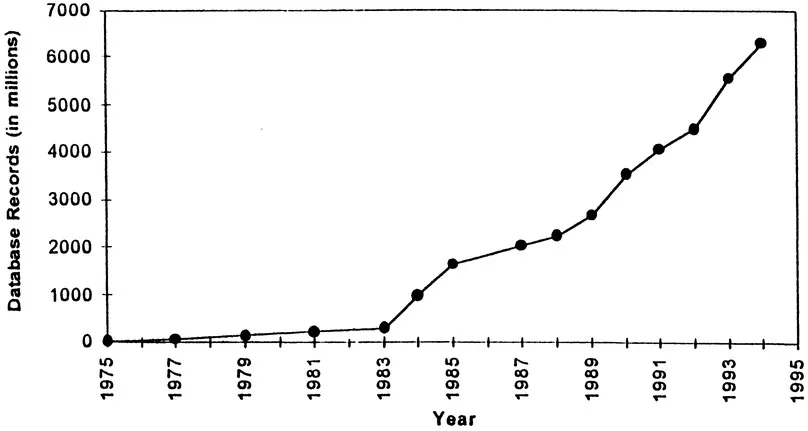
From 1975–1994 databases have grown by a factor of 28.2 (from 301 to 8,776), producers have grown by a factor of 13 (from 200 to 2,778), and vendors have grown by a factor of 15.1 (from 105 to 1,691) (see Fig. 1). The number of records contained in the databases has grown more dramatically. In 1975 the 301 databases contained about 52 million records. The 8,776 databases in 1994 contained some 6.3 billion records, a growth by a factor of 120.5 (see Fig. 2). The average number of databases per producer in 1994 was 3.0, and the average number of records per database was 791,954. Naturally, the range is very wide, from a few thousand records to tens of millions of records per database. In 1994 there were 367 databases that contained more than a million records. If one excludes those very large databases, the average database entry contains 109,593 records and the average database contains 99,640 records.
Looking at databases in terms of form of representation, 72 percent of data-bases in 1994 were of the word-oriented type (bibliographic, full-text, patent/ trademark, directory, and dictionary); 18 percent were number-oriented; 5 percent were image- or picture-oriented; 2 percent were audio- or sound-oriented; and the remaining 3 percent included various electronic services and software (where software databases are those that include manipulable and/or downloadable software for use on the user’s local personal computer or work station). Within the word-oriented databases, the full-text databases have grown the most in recent years. From 1985 through 1994 bibliographic databases grew by 67 percent and full-text databases grew by 547 percent. There are now more than 3,462 full-text databases, and much of the growth is due to the great increase in full-text databases on CD-ROM.
FIGURE 1
Growth in Number of Vendors, Producers, Database Entries, and Databases, 1975–1994
Growth in Number of Vendors, Producers, Database Entries, and Databases, 1975–1994
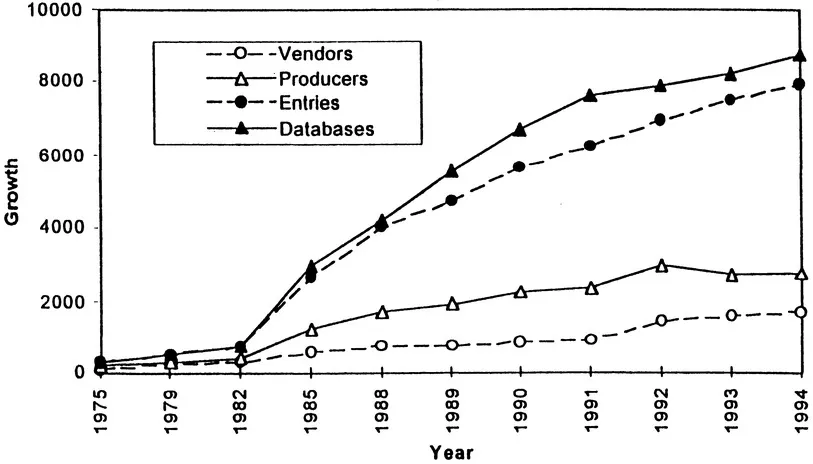
FIGURE 2
Number of Database Records, 1975–1995
Number of Database Records, 1975–1995
When looking at computer databases in terms of eight major subject classes—science/technology/engineering, business, health/life sciences, social sciences, humanities, law, news/general, and multidisciplinary—we find the class with the largest number of databases is business (32 percent); second, science/ technology/engineering (19 percent); third, law (12 percent); and fourth, health/ life sciences (9 percent). The remaining four classes make up 28 percent.
When classed by medium for access or distribution (online, batch, CD-ROM, diskette, magnetic tape, and handheld), the majority (57 percent) are accessed online, 5 percent are still available in batch mode; 20 percent are on CD-ROM; 10 percent are on diskette; 7 percent are available on magnetic tape, and 1 percent are handheld. It is worth noting that the use of magnetic tape for local mounting of databases is making inroads and supplanting the use of online in certain markets—especially in academe.
Databases are produced throughout the world. The percentage of databases produced in the United States has increased greatly since 1979. From 1975 through 1979 the U.S.:non-U.S. ratio was about 1:1, but from 1979 to 1985 it increased steadily and from 1985 through 1993 was about 2:1. In 1994 the non-U.S. fraction increased more than the U.S. fraction so that the ratio became 63 percent U.S. and 37 percent non-U.S. This change is partially due to the political changes in the formerly communist countries and expansion of commerce in the Pacific Rim. Producer status has also changed considerably from the late 1970s, when governments were responsible for 56 percent of databases and not-for-profits and commerce/industry each produced 22 percent. In 1994 commerce/industry was responsible for 76 percent; governments, 14 percent; and not-for-profits, including academic, 10 percent.
There are many ways to measure database success, but this discussion is limited to measuring the success of a database as an entity in the marketplace, and there we must look at usage and revenues. Payments are made for database use, and use is measured in several ways: on the basis of the amount of time spent online in searching a database; number of items retrieved, viewed, printed, downloaded, or otherwise accessed; number of searches conducted (the term search may be defined in accordance with the specific content of the database); packages of searches; use of computer ports for unlimited access during specific hours; subscriptions of many different types; and so on. This discussion is restricted to looking at database success in the marketplace where the market is the information center/library market in the United States. The databases are those that are available via the major vendors of word-oriented databases in the United States. These data are taken from the IMI Reports, which cover fourteen major vendors of word-oriented databases, for example, Mead Data Central (LEXIS, NEXIS), DIALOG, ORBIT, and WEST.
In 1974 there were approximately 750,000 searches conducted on fourteen vendor systems by users in the United States in the information center/library market. In 1982, there were about ten times as many searches, or 7.5 million; and in 1993, 58.3 million. Thus, in twenty years the number of searches increased by a factor of 78. Over the same time period baud rates changed from 300 to 1,200 to 2,400 to 9,600 to 14,400 to 28,880 and higher. Although different searching organizations have upgraded their modems at different times, and some have upgraded several times, the overall time per search decreased by more than 50 percent and the amount of material being searched in databases increased 10–25 fold depending on the specific database and how many backfiles stayed online. At the same time the charges levied per connect hour and per information unit delivered or accessed also increased. Files got bigger, prices for connect time and information units delivered went up, baud rates speeded up, search features were improved, front ends and interfaces became easier to use, searcher efficiency increased, and average search time decreased, but the average cost per search did not change much. The net result of these simultaneous changes over the years from 1978 through 1993 was very little change in the average cost per search in dollars of the day, but in CPI-adjusted dollars, the average cost per search went down considerably.
A closer look at this segment of the online database market, the information center/library market, shows that connect hours have increased by a factor of nearly 10, from 1978 with 780,000 hours to 1993 with more than 7 million hours. Revenues to the online vendors have increased by a factor of 28.6, from $40 million to $1.145 billion.
Usage and revenues have not been shared equally among vendors—far from it. Of the fourteen vendors monitored by the Information Market Indicators survey in 1993, three vendors (Mead Data Central [LEXIS/NEXIS], West, and DIALOG) had 81 percent of the use and 93 percent of the revenues. (See Williams 1995a.)
Producers whose databases were up on the 14 vendor systems numbered 360 in 1993, and the distribution of connect hours among them was disproportionate. The top three producers in 1993, Mead, West, and OCLC (all are also online vendors, and each in its producer status experienced use of more than 100,000 hours per quarter), had databases that amounted to 70 percent the total market usage. If one adds the National Library of Medicine (NLM) to this high-use group of producers whose databases generate more than 100,000 hours per quarter, then that group is responsible for 76 percent of the total market use among the 360 producers. Mead, West, OCLC, and NLM were the only producers to have more than 100,000 hours per quarter. The next 13 each had more than 10,000 hours per quarter, representing 13.5 percent of the hours; the next 35 producers each having at least 1,000 hours per quarter, made up 6.5 percent; 73 producers with at least 200 hours per quarter made up 1 percent; and the remaining 235 producers, each of whom had fewer than 200 hours per quarter, accounted for less than 3 percent.
Revenues associated with the same 360 producers are similarly distributed. The top 2 producers in terms of revenue were Mead and West; together they accounted for 64 percent of the revenues. The third producer was Chemical Abstracts Service, but the distance between the second and third is considerable and hence Chemical Abstracts should not be grouped with Mead and West. There were, however, 14 producers each of which generated at least $1 million per quarter. Although Mead and West each generated more than $75 million, the remaining 13 high-revenue producers each generated between $1 and $5 million per quarter and accounted for 11 percent of the revenue. The remaining revenues were distributed very much like the connect hours.
The revenues of the next 35 that generated more than $100,000 each, account for 4 percent of the revenues; 68 producers who generated more than $25,000 per quarter made up 1 percent of the market, leaving 241 producers who generated less than $25,000 per quarter making up 19 percent of the market. Individually these small producers do not account for much revenue, but as a group they represent $219 million, which is 19.12 percent of the total market ($1,145,000,000). The online database market is still growing, and the differences between the large and small players continue to become more extreme.
Often search intermediaries complain about the cost of online searching and tend to think that all database producers are making money at their expense. Few understand the high expenses associated with database production: that most databases do not enjoy a high enough level of use to produce sufficient online revenue to support their creation, and that a database is often largely supported by the corresponding print product. The foregoing statistics on database use and revenues should make these facts of life quite clear. Desirable as it may be to have an abundance of free information, as is available currently through the Internet, there still remains the need for quality information with the type of added value that many of the abstracting and indexing publishers as well as the publishers of numeric and transactional databases provide. The collection of information and the adding of value is done at considerable cost to database publishers and they must be compensated. Perhaps the announcement of the existence of various databases through the Internet and the free offering of sample databases will help to expand the market for online databases. The Internet provides many options for database publishers, and there is little doubt that innovative publishers will make effective use of it to the benefit of users and themselves.
Note
1. Portions of this article appear in Williams, 1995b, c.
References
Nolan, Kathleen Lopez, ed. 1995. The Gale Directory of Databases. Detroit: Gale Research.
Williams, Martha E. 1995a. Information Market Indicators: Information Center/Library Market, issue 47. Monticello, IL: Information Market Indicators, Inc.
Williams, Martha E. 1995b. Highlights of the Online/CDROM Database Industry: The Information Industry and the Role of the Internet. In Proceedings of the 16th National Online Meeting. Medford, NJ: Learned Information.
Williams, Martha E. 1995c. The State of Databases Today: 1995. In The Gale Directory of Databases. Detroit: Gale Research.
Williams, Martha E., and Sandra H. Rouse, comps. and eds. 1976. Computer-Readable Databases (CRDB): A Directory and Sourcebook. Washington, DC: American Society for Information Science.
2
Secondary Information Services—Mirrors of Scholarly Communication: Forces and Trends
Richard T. Kaser
It has been said that the "direct purpose" of scientific research is the "acquisition...
Table of contents
- Cover
- Half Title
- Title Page
- Copyright Page
- Contents
- Preface
- 1. Database Publishing Statistics
- 2. Secondary Information Services—Mirrors of Scholarly Communication: Forces and Trends
- 3. Resources for Research and Learning: The Databases of the Research Libraries Group
- 4. The OCLC Online Union Catalog: An Incomparable Library Resource
- 5. EMBASE—The Excerpta Medica Database: Quick and Comprehensive Drug Information
- 6. Growth and Change in the World’s Biological Literature as Reflected in BIOSIS Publications
- 7. Secondary Publishing in Changing Times: Profile of Cambridge Scientific Abstracts
- 8. Documenting the World’s Sociological Literature: Sociological Abstracts
- 9. Evolution and Revolution at PAIS: Technology and Concepts
- 10. The History and Scope of the American Economic Association’s EconLit and the Economic Literature Index
- 11. INFO-SOUTH: Leading the Way on the Information Superhighway to Latin America and the Caribbean
- 12. AgeLine Database on Middle Age and Aging: Reflecting Population Diversity
- 13. Statistics of Historical Abstracts and America: History and Life Databases
- 14. Statistics of RILM: Répertoire International de Littérature Musicale
- 15. Trends in Courses Taught: Insights from CMG’s College Faculty Database
- 16. Statistical Analysis of the TULSA Database, 1965–1994
- 17. A Brief History of the Abstract Bulletin of the Institute of Paper Science and Technology
- 18. Growth of the Computing Literature as Reflected in the Computing Information Directory, 1981–1995
- 19. Library of Congress Cataloging in Publication Program
- 20. The National Technical Information Service (NTIS) Bibliographic Database
- 21. Calculators and Crystal Balls: Predicting Journal Subscription Prices
- 22. Monitoring the Health of North America’s Small and Mid-Sized Book Publishers Since 1980
- 23. National Federation of Abstracting and Information Services Member Data Services
- 24. Growth and Change of the World’s Chemical Literature as Reflected in Chemical Abstracts
- 25. A Brief History of the Mathematical Literature
- 26. From Published Paper to MR Review: How Does It Happen?
- 27. The PASCAL and FRANCIS Databases of the Institut de l’Information Scientifique et Technique (France): Presentation and Statistics
- 28. Information Access Company: The Evolution of InfoTrac Multi-Source Databases and Their Importance to Library End-Users
- Contributors
Frequently asked questions
Yes, you can cancel anytime from the Subscription tab in your account settings on the Perlego website. Your subscription will stay active until the end of your current billing period. Learn how to cancel your subscription
No, books cannot be downloaded as external files, such as PDFs, for use outside of Perlego. However, you can download books within the Perlego app for offline reading on mobile or tablet. Learn how to download books offline
Perlego offers two plans: Essential and Complete
- Essential is ideal for learners and professionals who enjoy exploring a wide range of subjects. Access the Essential Library with 800,000+ trusted titles and best-sellers across business, personal growth, and the humanities. Includes unlimited reading time and Standard Read Aloud voice.
- Complete: Perfect for advanced learners and researchers needing full, unrestricted access. Unlock 1.5M+ books across hundreds of subjects, including academic and specialized titles. The Complete Plan also includes advanced features like Premium Read Aloud and Research Assistant.
We are an online textbook subscription service, where you can get access to an entire online library for less than the price of a single book per month. With over 1.5 million books across 990+ topics, we’ve got you covered! Learn about our mission
Look out for the read-aloud symbol on your next book to see if you can listen to it. The read-aloud tool reads text aloud for you, highlighting the text as it is being read. You can pause it, speed it up and slow it down. Learn more about Read Aloud
Yes! You can use the Perlego app on both iOS and Android devices to read anytime, anywhere — even offline. Perfect for commutes or when you’re on the go.
Please note we cannot support devices running on iOS 13 and Android 7 or earlier. Learn more about using the app
Please note we cannot support devices running on iOS 13 and Android 7 or earlier. Learn more about using the app
Yes, you can access Electronic Databases and Publishing by Albert Henderson in PDF and/or ePUB format, as well as other popular books in Languages & Linguistics & Library & Information Science. We have over 1.5 million books available in our catalogue for you to explore.