eBook - ePub
Economic Activity and Land Use The Changing Information Base for Localand Regional Studies
- 477 pages
- English
- ePUB (mobile friendly)
- Available on iOS & Android
eBook - ePub
Economic Activity and Land Use The Changing Information Base for Localand Regional Studies
About this book
Concerned primarily with statistical data, this text aims to provide a guide to the nature, uses, availability and limitations of the main data sources for interpreting and undertaking regional studies of economic activity. It also considers the methods used for the collection of this data.
Trusted by 375,005 students
Access to over 1.5 million titles for a fair monthly price.
Study more efficiently using our study tools.
Information
Subtopic
Business GeneralIndex
Social Sciences1
The information base: nature, changes and recommendations for improvement
1.1 Wain themes
In recent years the nature, quality and accessibility of the information base in the UK has become a key issue of debate among’research workers and decision-makers in business and local and central government. Concern about deterioration in the information base, particularly official statistics, was fuelled by the implementation in the early 1980s of the R&yner Review of the Government Statistical Services (Rayner 1980). In the late 1980s and early 1990s discussion over the accuracy and integrity of government statistics became more widespread. The Social Science Forum (SSF 1989) established a campaign for improvements to be made to government statistics and the Royal Statistical Society (RSS 1990) published an influential report entitled Official Statistics: Counting with Confidence. Debates also took place in Parliament (e.g. on the problems with statistics on unemployment and the National Accounts), on television (e.g. Channel 4 1989), and in the press (e.g. Waterhouse 1989a* b). The issues raised in these debates also apply to the important subset of UK information sources with which this book is concerned, namely those available for local and regional studies of economic activity and land use. This introductory chapter attempts to give a context for the subsequent chapters by reviewing the main features of the information base, the ways in which it is changing, and recommendations to improve it
The paucity of appropriate, accurate, up-to-date information on variations from place to place in the nature of economic activity and land use has been a theme developed in earlier reviews (Coppock 1978; England et ah 1985; Healey 1983; Owen 1988). Unfortunately, as most local and regional statistics are derived from disaggregations of national official data sets, any deterioration in the quality of the latter is magnified the smaller the area under consideration. Increasing dissatisfaction with the official statistics available for subnational analysis has encouraged two trends. First, many research workers have been forced to undertake or commission their own surveys’of businesses and land uses. This raises questions about the optimal allocation of the nation’s resources concerned with data collection because in many cases it has led to several different organizations collecting similar information. A second trend has been for a growth to occur in the number of – private-sector organizations providing local data. As access to this Information is determined by the ability to pay it is leading to distinctions between information-rich and information-poor groups and regions (Opensiaw and Goddard 1987). Charges for official statistics are also becoming more common.
A further treed has been the growing importance of information systems used to store and analyse the information used by local and regional research workers. Whereas the quality of “Database UK’ las decreased over recent years, the quality of the information systems developed to handle the data has improved significantly. The rapid growth of interest in geographical information systems (GIS), in particular, is witnessed by the Committee of Enquiry set up by the government under Lori Chorley, and its report Handling Geographic Information (Department of the Environment (DoE) 1987); the initiative by the Economic and Social Research Council (ESRC) in establishing eight Regional Research Laboratories in 1988; and the launch the following year of the Association for Geographic Information. Although GIS can now be regarded as ‘having reached the age of maturity’ (Newby 1988: 8), concern has been expressed that ‘without high quality, nationally available statistical series covering the key issues of social concern, GIS will never graduate from being a sophisticated toy to an effective decision-making tool’ (Worrall 1990: 7). This emphasizes that discussions concerned with the handling of data should not be separated from those concerned with data collection, quality and availability. The need for good-quality data applies even more so to forecasting local and regional economic change because any inaccuracies are amplified. Existing social and economic statistics fall far short of what is needed to implement an adequate working model of a complex spatial economy. As one commentator recently summed it up: ‘nice model, pity about the data’ (Hunter 1989: 26). A further issue, which is raised by the increased ease of handling information brought about by computerization and on-line access, is that of confidentiality and copyright. Security systems need to be developed to restrict access to confidential information and to prevent infringement of copyright.
1.2 Nature of the information base
The information base for local and regional studies of economic activity and land use is highly selective. The information is structured by: what questions are asked, of whom? and when; how accurate and representative the methods of data collection are; what information is analysed; how the data are held; whether the information can be manipulated by the user; how the data are aggregated (e.g. spatially and sectorally); what information is published; what access there is to unpublished data; and how much it costs. Attention in this section is focused on three factors which underlie the nature of most of the data available. They are: how the information is classified; what statistical and spatial units are used for collecting, storing and presenting the data; and the way the information is collected.
Classifications of economic activity and land use
The UK economy consists of a range of economic activities ‘through which goods are produced or services rendered by firms and other organisations’ (Central Statistical Office (CSO) 1979: 2). Similar economic activities may be grouped together into Industries’, for example into agriculture, coal extraction, motor vehicle manufacture, banking and finance, retail distribution, air transport. These industries occupy land and may therefore also be considered as land uses, but the use of land by human activities is not necessarily always for financial profit or gain. A basic distinction may be made between urban (e.g. industry, offices, housing) and rural (e.g. agriculture, forestry, recreation) land uses. For analytical purposes various classifications of economic activities and land uses have been developed. They provide a uniform and comparable framework for the collection, presentation and analysis of data. Most are based on the ‘major’ activity or use and exclude minor activities and uses.
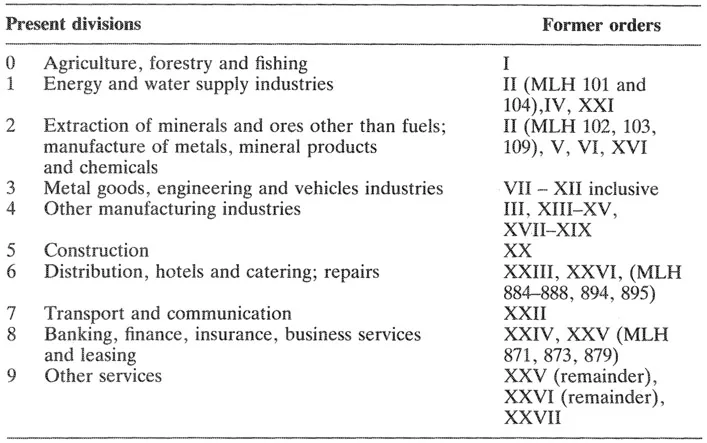
The first comprehensive Standard Industrial Classification (SIC) for the UK was issued in 1948. It was subsequently revised in 1958, 1968 and 1980 to take account of changes in the organization and relative importance of a number of industries, and to distinguish new industries not separately identified previously. The 1980 revision brought the SIC in line as closely as was practicable with the ‘Nomenclature Générale des Activités Economiques dans les Communautés Européennes’ (NACE) classification used by the Statistical Office of the European Community (EC). It can also be rearranged to agree with the United Nations International Standard Industrial Classification (ISIC) at aggregated levels (CSO 1979). Unlike the 1968 SIC which has 27 orders, each divided into a number of minimum list headings (MLH) denoted by three-digit numbers (181 in all), the 1980 SIC has a hierarchical structure based on 10 divisions (denoted by a single digit), 60 classes (two digits), 222 groups (three digits) and 334 activity headings (four digits). A summary of the relationship between the two classifications is shown in Table 1.1.
There are several other classifications which may be used in conjunction with the industrial classification. These include, for example, the classification of occupations, which categorizes workers on the basis of the kind of job they do rather than on the basis of the industry in which they work. A revised Standard Occupational Classification (SOC) was published in 1990 (Employment Department Group and Office of Population Censuses and Surveys (OPCS) 1990). An example of its application is given in Appendix 11.4. It was designed as a single up-to-date classification to replace CODOT (Classification of Occupations and Directory of Occupational Titles) and the 1980 version of the Classification of Occupations (GPCS 1980, and also Ch. 2), Another classification is that of products. An example of this is the alphabetical list of industries and their typical products which accompanies the 1980 SIC (CSO 1980). A further one is the Use Classes Order which local authorities employ in deciding on whether or not to grant planning permission to proposed developments. The Town and Country Planning (Use Classes) Order 1987 introduced a new business use class (Bl) which involved a combination of the previous office (II), light industrial (III) and warehouse (X) use classes. This was intended to remove restrictions on the supply of multi-use accommodation appropriate for high-technology industry (Henneberry 1988).
Table 1.1 Comparison of 1980 and 1968 SICs. (Source: CSO 1979:3)
There are also several different ways of classifying land use. An important distinction may be made between formal and functional classifications. The first kind is based on the land form or cover, for example types of building or open space, whereas the second kind is based on the land function or activity and concerns what land is actually used for. One of the simplest land use classifications is the sixfold division used by the First Land Utilization Survey of Britain into: arable; heath and rough pasture; orchards and nurseries; meadowland; forest and woodland; urban areas. The more recent Second Land Utilization Survey is more comprehensive in that it identified 70 land use types, grouped into 13 major classes (Ch. 7). Meither survey, however, provided much detail for urban areas. A more balanced classification is used by the DoE in the annual reports it has published on land use changes in England since 1986. Urban and rural iand uses are each divided into 5 groups, which are further subdivided into 24 categories (see Fig. 6.1). An earlier taxonomy which provided much more detail on urban land uses was the National Land Use Classification (NLUC) which was devised to serve the various purposes of planning throughout the country (NLUC 1975). It is a hierarchical system with 15 major orders, 78 groups, 150 subgroups and over 600 classes. Interestingly, an attempt was made to relate the NLUC to the 1968 SIC which meant that some limited connection between land use and economic activity was forged (Ch. 6).
Statistical and spatial units
The ways in which the statistical and spatial units used in collecting economic activity and land use statistics are defined is important because they can affect how the information is interpreted. For instance, the use of different statistical units for different enquiries can result in different findings. An example is given in Chapter 16 of how the numbers employed in manufacturing industries in Great Britain differ by up to 9 per cent, according to which source is used, and by up to 50 per cent for individual industries (two-digit classes) (see Tables 16.1 and 16.2). Different findings may also occur between studies using different spatial units. It is an ecological fallacy to assume that a description or relationship found using one spatial unit (e.g. local authority areas) applies to another (e.g. households or standard regions) (Openshaw 1987). The problems of statistical and spatial data collection units may be illustrated with the cases of the SIC and land use surveys respectively.
The SIC is applied to units on the basis of their principal activity (CSO 1979). Frequently there is no problem in defining the relevant unit. This applies, for example, where the unit is at a single address, all its activities occur within the same heading of the classification, and it is operated as a separate unit for record-keeping and accounting purposes. However, in many cases the situation is more complex. Sometimes a unit produces, sells or provides a variety of goods or services, in which case the unit as a whole is allocated to the industry in which the greater part of its production, sales or services are found. Another difficulty can occur when dealing with large organizations operating at several locations. Frequently some of the data required cannot be provided for each site, because the organizations have centralized information systems. For example, many retail chains operate centralized purchasing and stockholding arrangements. Sometimes in order to secure compatibility between different enquiries some units may be allocated to more than one classification. For instance, a unit at one address may be able to provide a limited amount of information, such as employment, but for more comprehensive information it may have to be combined with other units under the same ownership which are mainly engaged in a different activity. Where units located in different places are combined, as happens sometimes with data in the annual Census of Production, the potential for accurate geographical analyses is limited (Ch. 4).
Conceptual and practical difficulties also occur in defining spatial units for the collection and presentation of land use data. As Rhind and Hudson (1980: 20) point out:
Choice of the ‘geographical individual’ – the section of ground which is considered as a unit for subsequent purposes – has considerable implications for analysis and even more for the level of effort needed for any ground survey. Frequently, however, choice of spatial unit is outside the scope of the end-user of the data and, if particular technology is used, of even the data collector.
Land use data may be collected by using point samples, line samples and zones or areas. The last is much the most common way of treating land use both in surveys and in storing the data in map form. The principle is that within each zone, for example a field in a cultivated rural area, land use should be homogeneous or as near this as makes no difference for the intended use of the data. The amount of detail is, however, limited by the human resources available for a survey, the spatial resolution of the technology being used, or, most sensibly, the purpose for which the data are collected. For example, the 1969 Survey of Developed Areas in England and Wales excluded any discrete areas of built-up land less than 5 ha in extent. Land use mapping based on remote sensing techniques vary widely from scales of about 1: 2500 for low-altitude photograph...
Table of contents
- Cover
- Title
- Copyright
- Contents
- List of figures
- List of tables
- Editor’s preface
- Acknowledgements
- Abbreviations and acronyms
- List of contributors
- 1 The information base: nature, changes and recommendations for improvement
- Part One Measuring economic activity and land use
- Part Two Monitoring economic activity and land use
- Part Three Economic sectors
- Annex 1 Useful addresses
- Index
Frequently asked questions
Yes, you can cancel anytime from the Subscription tab in your account settings on the Perlego website. Your subscription will stay active until the end of your current billing period. Learn how to cancel your subscription
No, books cannot be downloaded as external files, such as PDFs, for use outside of Perlego. However, you can download books within the Perlego app for offline reading on mobile or tablet. Learn how to download books offline
Perlego offers two plans: Essential and Complete
- Essential is ideal for learners and professionals who enjoy exploring a wide range of subjects. Access the Essential Library with 800,000+ trusted titles and best-sellers across business, personal growth, and the humanities. Includes unlimited reading time and Standard Read Aloud voice.
- Complete: Perfect for advanced learners and researchers needing full, unrestricted access. Unlock 1.5M+ books across hundreds of subjects, including academic and specialized titles. The Complete Plan also includes advanced features like Premium Read Aloud and Research Assistant.
We are an online textbook subscription service, where you can get access to an entire online library for less than the price of a single book per month. With over 1.5 million books across 990+ topics, we’ve got you covered! Learn about our mission
Look out for the read-aloud symbol on your next book to see if you can listen to it. The read-aloud tool reads text aloud for you, highlighting the text as it is being read. You can pause it, speed it up and slow it down. Learn more about Read Aloud
Yes! You can use the Perlego app on both iOS and Android devices to read anytime, anywhere — even offline. Perfect for commutes or when you’re on the go.
Please note we cannot support devices running on iOS 13 and Android 7 or earlier. Learn more about using the app
Please note we cannot support devices running on iOS 13 and Android 7 or earlier. Learn more about using the app
Yes, you can access Economic Activity and Land Use The Changing Information Base for Localand Regional Studies by Michael J. Healey in PDF and/or ePUB format, as well as other popular books in Social Sciences & Business General. We have over 1.5 million books available in our catalogue for you to explore.