![]()
Chapter 1
Climate Change
Introduction
Climate change is now established as a major problem for governments and the international community to address. The bulk of this book is devoted to carbon markets – market-based solutions designed to address the problem. However, to understand the context within which these markets operate, it is necessary to have a basic knowledge of the science and likely impacts of climate change.
Climate change is a relatively new phrase in day-to-day language. It joins a number of others in the same field – ‘the greenhouse effect’, ‘global warming’, ‘carbon’, ‘carbon dioxide’ and ‘greenhouse gases’ to name a few. This chapter seeks to provide a layperson’s guide. It explains the basic scientific process involved, where the relevant emissions come from, how they are changing and what the impacts are on the natural environment and human society. These issues are inevitably more complex than we can explain here in great detail. For a fuller explanation interested readers should refer elsewhere, most notably to the reports that set out the consensus of world scientific opinion – the ‘Fourth Assessment Report of the Intergovernmental Panel on Climate Change’. With climate change at the top of the international agenda, understanding both the basics of the science and the context is a prerequisite to acting wisely in a carbon-constrained 21st century.
A Brief Overview of the Science
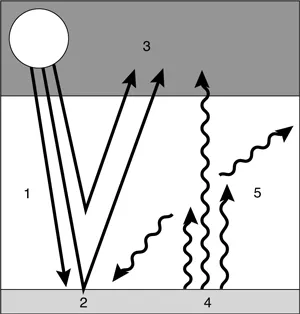
The greenhouse effect is a natural phenomenon that maintains an average temperature of 15°C on Earth, allowing life to exist. It is caused by the natural presence of gases, the so-called greenhouse gases (GHGs), which trap part of the sun’s heat in the atmosphere. On the following page is a brief description of the natural phenomenon.
Figure 1.1 Greenhouse effect
The main GHG is water vapour. But if one limits consideration to the anthropogenic greenhouse effect (i.e. additional to the natural greenhouse effect), human emissions of water vapour have virtually no impact. Because the planet is two thirds covered by water, the average water vapour content of the atmosphere depends largely on temperature. The average residence time of water in the atmosphere is only of the order of a week and therefore anthropogenic emissions of water vapour do not significantly alter the global water cycle, although higher temperatures caused by anthropogenic climate change are amplified by a positive feedback from increased atmospheric water vapour (Jancovici, 2002).
Carbon dioxide (CO2) is the primary cause of the human-induced greenhouse effect. Its average lifetime in the atmosphere is approximately 125 years, which means that the effect of emissions reduction measures taken today on future concentrations are slowed by this significant inertia. This CO2 released by human activities (83 per cent of emissions of the European Union (EU) in 2005) comes mainly from burning fossil fuels and deforestation. Methane (7 per cent of EU emissions in 2005) from the burning of forests, ruminant livestock, rice paddies, farms and landfill gas, nitrous oxide (NOx) (8 per cent of EU emissions in 2005) from fertilizers and some chemical processes, halocarbons (1 per cent of EU emissions in 2005) for example from refrigerant gases, and tropospheric ozone (from the combustion of hydrocarbons) are the main other GHGs.1
The development of human activities has significantly altered the concentration of GHGs in the atmosphere. This change in concentration is a phenomenon that has been identified for a long time. In 1896, chemist Svante Arrhenius had already found that the concentration of CO2 into the atmosphere had increased considerably since the beginning of the Industrial Revolution (Arrhenius, 1896). Understanding that this increase would grow in parallel with the growth in consumption of fossil energy, and knowing the role of CO2 in the augmentation of temperature, the Swedish scholar concluded that if the concentration of CO2 doubled, the temperature would rise by several degrees Celsius.2
The strong growth of our fossil fuel consumption is inevitably accompanied by release of GHGs into the atmosphere. Indeed, by burning oil, natural gas and coal that are the results of slow decomposition of plant residue layers that had captured atmospheric carbon for millions of years, we emit into the atmosphere an additional quantity of GHGs that disturbs the carbon cycle through photosynthesis and respiration in the natural world. In a few decades we release CO2 that was emitted and captured by ecosystems over millions of years.
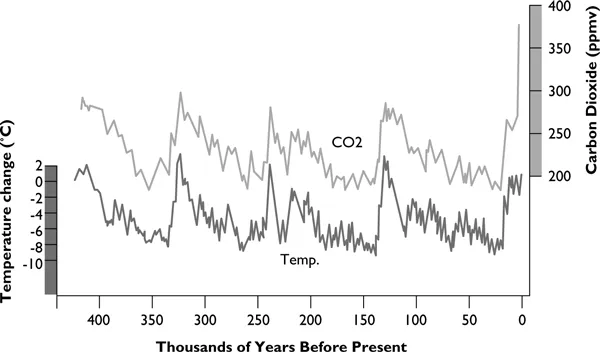
Although the quantity of CO2 emissions resulting from anthropogenic activities is small compared with those in the natural carbon cycle (involving forests, soils and oceans), these additional quantities are not completely recycled by ecosystems. The Intergovernmental Panel on Climate Change (IPCC) estimates that, of the 7 billion tonnes of carbon equivalents (7GtCe, roughly 26GtCO2e)3 released yearly by human activities, about 4GtCe remain in the atmosphere without being recycled, causing an increase in GHG concentration from 280 parts per million (ppm) since pre-industrial times to 430ppm today (including all GHGs (IPCC, 2007). At the current level of anthropogenic emissions, the concentration increases by about 4ppm each and every year. This increasing concentration is consistent with the observed average atmospheric warming of +0.7°C since the pre-industrial era, with significant spatial variability (greater warming at the poles with less warming at the equator and mid-latitudes).
Figure 1.2 Evolution of temperature and CO2 concentration
Today, the concentration of GHGs is higher than at any time during the last 450,000 years and the IPCC projections indicate that it will continue to increase. The concentration of CO2 alone has already increased by 35 per cent (from 280ppm to 380ppm) in the atmosphere since the Industrial Revolution, and the IPCC predicts that this concentration could triple (Special Report on Emissions Scenarios (SRES) A2 scenario4) by 2100 if no action is taken, given its current progress.
In its Fourth Assessment Report (2007), the IPCC felt it was ‘very likely’ (90 per cent chance of occurrence) that man is responsible for the warming observed in the 20th century. The IPCC considered it ‘very likely’ that the continuation of anthropogenic emissions will lead in the 21st century to a further warming greater than that of the 20th century. The climate sensitivity (i.e. the equilibrium change in global mean surface temperature following a doubling of the atmospheric equivalent CO 2concentration [CO2e]) is probably between 2 and 4.5°C, with a best estimate of about 3°C.
Distribution and evolution of GHG Emissions
GHG Emissions by Country
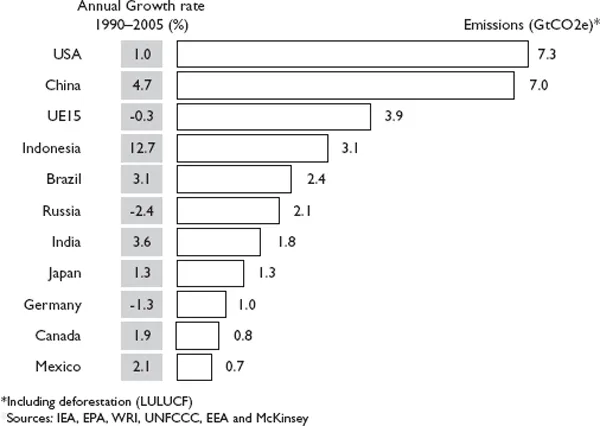
The United States of America (US) was the biggest emitter of GHGs in the world in 2005. With just over 5 per cent of the world population, the US is responsible for more than a quarter of global GHG emissions. Since 1990, its carbon emissions have increased by an average of 1 per cent per annum. China, which has more than 20 per cent of the world’s population, was the second largest emitter of GHGs. Due to a high growth rate, it is estimated that emissions from China exceeded those from the US in late 2007. The EU15 countries (EU countries that were already members upon ratification of the Kyoto Protocol) come in third place. The case of Indonesia and Brazil is special. Although these countries directly emit fewer GHGs than Russia, they occupy the top five places when one takes into account the emission/absorption balance of GHGs from deforestation. The case of Indonesia is particularly worrying because its annual growth rate has reached 12.7 per cent due to the combined effect of increased direct emissions and extended deforestation (part of which is palm oil production, responding to the growing demand for biofuels). In absolute terms, the annual growth of Indonesian emissions corresponds to the total emissions of Benelux, and is comparable to that of the annual growth from China. Among the major polluters, only the EU15 (collectively), Russia and Germany have experienced a decline in their emissions since 1990. The decreases in emissions in Russia and Germany are mainly due to transition periods following the fall of communist regimes, when many heavy industries collapsed.
As well as absolute emissions per country, it is interesting to be aware of average per capita emissions by country. Global emissions of anthropogenic GHGs were around 26GtCO2e in 2005 for approximately 6.5 billion people, making the world average 4 tonnes of CO2e per capita. We have seen that ecosystems are able to absorb about 3GtC (11GtCO2e). This means that the Earth can absorb a release of 1.7 tonnes of CO2 per capita. Taking into account expected population growth, average per capita emissions need to be below this level if we are to stabilize the global climate.
The chart below (Figure 1.3) shows the values for a dozen countries. Citizens from Australia, Canada and the US are the biggest emitters with emissions of GHGs per capita of more than 24 tonnes of CO2e. These high emissions are partly explained by the lifestyle in these countries (widespread use of air conditioning, high meat consumption) and also by their electricity industry (mainly coal in the US and Australia) and transport systems, which focus on private cars and domestic airlines (which unlike international flights are included in national emissions inventories). Oil and gas extraction (Canada and US) and mining (Canada and Australia) are also important sources. High emissions in the Netherlands (in comparison with the EU15 average) are partly explained by the importance of chemical and refining industries in Holland. In China, a country often stigmatized since it exceeded the emissions of the US, average per capita emissions are just above the average global per capita value. The figure for India, comparable to many countries in sub-Saharan Africa, illustrates the state of underdevelopment in a large part of the subcontinent. However, this low level is the emission level we should strive for if we want to stabilize the concentration of GHGs in the atmosphere.
Figure 1.3 Emissions and annual growth for main GHG emitters
What can we learn from these figures? On the one hand that significant differences exist between developed countries and developing countries (e.g. all countries in sub-Saharan Africa, excluding South Africa, lie between 1 and 4 tonnes of CO2e per capita). On the other hand there is a significant difference among Organisation for Economic Co-operation and Development (OECD) countries. For the pessimists, the figures from the top three indicate that emissions of GHGs have a very important growth potential if we all adopt an ‘American way of life’. For the optimists, the difference between the emission of GHGs per capita in Europe (10 tonnes) and North America (more than 24 tonnes) suggests that the correlation between well-being and emissions is far from complete and it is possible to have a good quality of life with emissions 60 per cent lower than those of the US. Note that a country such as Switzerland, with an economy largely dependent on the services sector, reached a very high standard of living with per capita emissions of 7 tonnes of CO2e. Moreover, the lower use of fossil fuel in Europe could increase its competitiveness, while oil dependency in the US is already a burden for the American trade balance. Finally, it is worth clarifying that ...