This thorough update to Benjamin Compaine's original 1979 benchmark and 1982 revisit of media ownership tackles the question of media ownership, providing a detailed examination of the current state of the media industry. Retaining the wealth of data of the earlier volumes, Compaine and his co-author Douglas Gomery chronicle the myriad changes in the media industry and the factors contributing to these changes. They also examine how the media industry is being reshaped by technological forces in all segments, as well as by social and cultural reactions to these forces.
This third edition of Who Owns the Media? has been reorganized and expanded, reflecting the evolution of the media industry structure. Looking beyond conventional wisdom and expectations, Compaine and Gomery examine the characteristics of competition in the media marketplace, present alternative positions on the meanings of concentration, and ultimately urge readers to draw their own conclusions on an issue that is neither black nor white.
Appropriate for media practitioners and sociologists, historians, and economists studying mass media, this volume can also be used for advanced courses in broadcasting, journalism, mass communication, telecommunications, and media education. As a new benchmark for the current state of media ownership, it is invaluable to anyone needing to understand who controls the media and thus the information and entertainment messages received by media consumers.
eBook - ePub
Who Owns the Media?
Competition and Concentration in the Mass Media industry
- 632 pages
- English
- ePUB (mobile friendly)
- Available on iOS & Android
eBook - ePub
Who Owns the Media?
Competition and Concentration in the Mass Media industry
About this book
Trusted by 375,005 students
Access to over 1.5 million titles for a fair monthly price.
Study more efficiently using our study tools.
Information
Subtopic
Media & Communications IndustryIndex
Social Sciences1
The Newspaper Industry
The state of the newspaper industry at the end of the 1990s is not good, although individual publishers remain healthy and profitable. This apparent paradox is easily explained. On the one hand, since 1987, newspaper circulation has steadily declined. Circulation based on per household measure has been falling for decades. The number of newspapers has fallen. The amount of time those who look at newspapers spend with them is down. The percentage of total advertising revenue that goes to newspapers has shrunk. There are fewer cities than ever with fully competing newspapers each day.
On the other hand, those newspapers that have survived the thinning out of the 1970s and 1980s, in true Darwinian fashion, are more efficient, have positioned themselves better and, arguably, have provided a better product for their readers. More often than not they are part of multinewspaper groups. Gone are independents like the Philadelphia Bulletin, the Washington Star and the Houston Post. Although there are fewer advertising dollars for newspapers, they are split among fewer establishments. Although circulation is lower, declines are not uniform. In cities where a single publisher remains, circulation is higher, but it is less than the combined circulation of the two papers that used to be there.
For the most part, the newspaper groups of 1998 were the same as in 1980: Gannett, Knight-Ridder, Lee Enterprises, McClatchy among them. But there has been an ebb and flow. Thomson, which had owned more newspapers than any other group, was selling off many of its papers to concentrate on financial information and online distribution. Harte-Hanks has divested all its papers to focus on direct marketing. News Corp., which seemed poised to become a major player in newspapers, retained only the New York Post, having gone on to concentrate on broadcasting and film production.
Besides these trends, the other big development for newspapers has been the coming of the World Wide Web. Although in 1982 the Internet was not foreseen as the vehicle for the electronic newspaper, the development of something like it was being discussed:
The technology that transformed the internal methods for producing the newspaper in the 1970s, i.e., computers and video display terminals, was threatening to reach out to the world of the consumer. Systems were being put in place to create what might be called the electronic newspaper, videotext, or data base publishing. Whatever the term, implicit was the promise that the consumer would be able to get all or much of the content of the newspaper delivered via some electronic highway. Telephone lines were one route. The cable that brought in video was another. Over the air, via broadcasting, was yet a third pathway.1
It took another 15 years until this potential started to become a reality. By 1998, 492 daily newspapers had versions available on the Web.2 After some early experiments with subscriptions, all but a few retreated to an advertiser support model. Few, if any, could be truly said to be profitable. And even those were generating only a fraction of the revenue of the mainstream print product. But the Web was showing the way for newspaper-like content that bypassed the economic bottlenecks of the costs of printing and distribution, opening the way for both new and nontraditional providers to offer content to consumers (see Chapter 7).
This chapter examines the players in the newspaper industry in the late 1990s and the research that addresses concerns of chains and ownership structure. Consistent with most of the other chapters, it looks in particular at the changes in the industry since the early 1980s.
GENERAL CHARACTERISTICS
With its origins in the United States dating back to the earliest colonial days, it should not be surprising that the newspaper industry is economically mature. Table 1.1 shows it has been declining in relative economic terms for nearly four decades, from accounting for 0.8% of gross domestic product (GDP) to under 0.5%. Advertising revenue (Table 1.2), although increasing in absolute terms, has been falling consistently since the 1930s. In 1998, expenditures on television advertising was 23.5% of the total, as compared with 21.8% for newspapers. It was not until the mid-1990s that television advertising (broadcast and cable) surpassed newspapers. Circulation has been falling for years, with daily circulation of 56.2 million in 1998, which is 11% below the peak of 63.1 million reached in 1973 (see Table 1.3). This decline is more substantial in light of the increase in the number of households—the primary purchasing unit for newspapers—by 44% in this period.
TABLE 1.1
Newspaper Shipments and GDP, Selected Years, 1960–1995 (in current $)
Newspaper Shipments and GDP, Selected Years, 1960–1995 (in current $)
GDP (in billions) | Newspaper Shipments (in millions) | Newspapers as % of GDP | |
1960 | $ 513 | $ 4,100 | 0.80 |
1970 | 1,011 | 7,000 | 0.69 |
1982 | 3,242 | 21,276 | 0.66 |
1990 | 5,744 | 35,235 | 0.61 |
1995 | 7,265 | 35,576 | 0.49 |
1996 | 7,636 | 37,225 | 0.49 |
Source: U.S. Department of Commerce.
TABLE 1.2
Newspaper Advertising as Percent of Total Advertising, Selected Years, 1935–1997
Newspaper Advertising as Percent of Total Advertising, Selected Years, 1935–1997
% of All Advertising | Newspaper Ad Revenue (in millions $) | |
1935 | 45.1 | $ 762 |
1945 | 32.0 | 921 |
1955 | 33.6 | 3,088 |
1965 | 29.0 | 4,457 |
1975 | 29.9 | 8,442 |
1985 | 26.6 | 25,170 |
1995 | 22.5 | 36,092 |
1998 | 21.8 | 43,925 |
Sources: Newspaper Association of America, Facts About Newspapers, 1999, Table 9, Web site at www.naa.org/info/facts99/09.html, accessed July 23, 1999; Compaine, The Newspaper Industry in the 1980s (White Plains, NY: Knowledge Industry Publications, 1980), p. 59.
TABLE 1.3
Daily Newspaper Circulation in the United States, Selected Years, 1920–1998
Daily Newspaper Circulation in the United States, Selected Years, 1920–1998
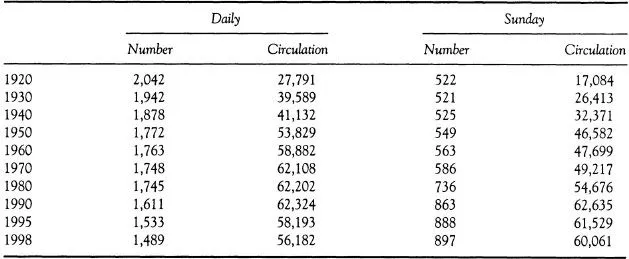
Sources: 1920–1980: Editor & Publisher International Year Book, annual editions. 1990–1998: Newspaper Association of America, Facts About Newspapers, 1999. Tables 11 and 12, Web site at www.naa.org/info/facts99/, accessed July 23, 1999.
There were 1,489 daily newspapers of general circulation in 1998, a level that has been declining steadily since the 1980s. In addition, there were about 8,000 other newspapers, including about 295 foreign language and ethnic dailies, professional, business and special service dailies.3 Whereas this chapter concentrates on the daily newspapers of general interest, the less than daily newspapers are a vigorous part of the industry structure. They are also the most robust segment. As seen in Table 1.4, weekly newspapers have achieved significant circulation growth, both in average size and in aggregate numbers.
TABLE 1.4
Weekly Newspapers Circulation Growth, Selected Years, 1960–1998
Weekly Newspapers Circulation Growth, Selected Years, 1960–1998
Total Weekly Newspapers | Average Circulation | Total Weekly Circulation | |
1960 | 8,174 | 2,566 | 20,974 |
1970 | 7,612 | 3,660 | 27,857 |
1980 | 7,954 | 5,324 | 42,348 |
1985 | 7,704 | 6,359 | 48,989 |
1990 | 7,550 | 7,309 | 55,181 |
1995 | 7,915 | 9,425 | 79,668 |
1998 | 8,193 | 9,067 | 74,284 |
Sources: Newspaper Association of America, Facts About Newspapers, 1999, Table 27, Web site at www.naa.org/info/facts99/, accessed July 23, 1999. 1995 and 1998 figures not comparable to previous years due to changes in how NAA collects its data.
The newspaper industry is one of the country’s largest manufacturing employers. Newspaper employment reached its peak at 542,000 in 1989 and declined substantially over the next few years (Table 1.5). It had dropped nearly 12% by 1996, before a modest upturn in 1997. This is about twice the level of the decrease in the number of daily newspapers and a third greater than the decline in daily circulation. Overall, newspaper employment has decreased while civilian employment has increased.
TABLE 1.5
Newspaper Employment Compared to Total U.S. Civilian Employment, Selected Years, 1970–1997 (Index: 1987 = 100)
Newspaper Employment Compared to Total U.S. Civilian Employment, Selected Years, 1970–1997 (Index: 1987 = 100)
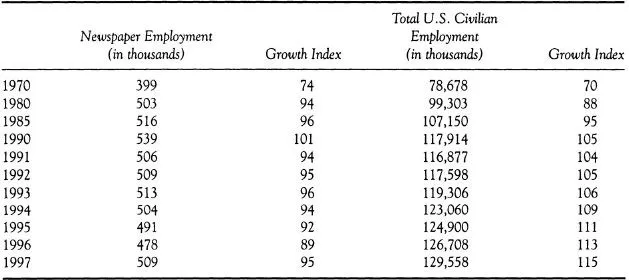
Sources: Calculations based on data from Newspaper Association of America, Facts About Newspapers, 1997; U.S. Bureau of Labor Statistics, Household Survey.
Profitability
Interest in starting, buying and owning newspapers is a positive indicator of the financial health of the industry. The rapid rate with which newspapers have been bought at increasingly higher multiples of dollars per reader or earnings is a sign of a prosperous industry. Table 1.6 lists the revenues and profits for publicly held companies that derive a substantial portion of their revenue from newspaper operations. Net profit margins in 1997 ranged from about 15.1% for Gannett to 5.5% for Hollinger. In a year, any given firm may deviate substantially from industry norms or even its own norms. In 1997, Dow Jones showed a $802 million loss, which reflected the write down in the value of its Telerate operation prior to its sale. The previous year, D...
Table of contents
- Cover
- Half Title
- Title Page
- Copyright Page
- Dedication
- Table of Contents
- Tables and Figures
- Foreword
- Preface
- 1 The Newspaper Industry
- 2 The Book Publishing Industry
- 3 The Magazine Industry
- 4 The Television Industries: Broadcast, Cable, and Satellite
- 5 Radio Broadcasting and the Music Industry
- 6 The Hollywood Film Industry: Theatrical Exhibition, Pay TV, and Home Video
- 7 The Online Information Industry
- 8 Who Owns the Media Companies?
- 9 Interpreting Media Ownership
- 10 Distinguishing Between Concentration and Competition
- Afterword
- Author Index
- Subject Index
Frequently asked questions
Yes, you can cancel anytime from the Subscription tab in your account settings on the Perlego website. Your subscription will stay active until the end of your current billing period. Learn how to cancel your subscription
No, books cannot be downloaded as external files, such as PDFs, for use outside of Perlego. However, you can download books within the Perlego app for offline reading on mobile or tablet. Learn how to download books offline
Perlego offers two plans: Essential and Complete
- Essential is ideal for learners and professionals who enjoy exploring a wide range of subjects. Access the Essential Library with 800,000+ trusted titles and best-sellers across business, personal growth, and the humanities. Includes unlimited reading time and Standard Read Aloud voice.
- Complete: Perfect for advanced learners and researchers needing full, unrestricted access. Unlock 1.5M+ books across hundreds of subjects, including academic and specialized titles. The Complete Plan also includes advanced features like Premium Read Aloud and Research Assistant.
We are an online textbook subscription service, where you can get access to an entire online library for less than the price of a single book per month. With over 1.5 million books across 990+ topics, we’ve got you covered! Learn about our mission
Look out for the read-aloud symbol on your next book to see if you can listen to it. The read-aloud tool reads text aloud for you, highlighting the text as it is being read. You can pause it, speed it up and slow it down. Learn more about Read Aloud
Yes! You can use the Perlego app on both iOS and Android devices to read anytime, anywhere — even offline. Perfect for commutes or when you’re on the go.
Please note we cannot support devices running on iOS 13 and Android 7 or earlier. Learn more about using the app
Please note we cannot support devices running on iOS 13 and Android 7 or earlier. Learn more about using the app
Yes, you can access Who Owns the Media? by Benjamin M. Compaine,Douglas Gomery in PDF and/or ePUB format, as well as other popular books in Social Sciences & Media & Communications Industry. We have over 1.5 million books available in our catalogue for you to explore.