A Primer of Signal Detection Theory is being reprinted to fill the gap in literature on Signal Detection Theory--a theory that is still important in psychology, hearing, vision, audiology, and related subjects. This book is intended to present the methods of Signal Detection Theory to a person with a basic mathematical background. It assumes knowledge only of elementary algebra and elementary statistics. Symbols and terminology are kept at a basic level so that the eventual and hoped for transfer to a more advanced text will be accomplished as easily as possible.
Intended for undergraduate students at an introductory level, the book is divided into two sections. The first part introduces the basic ideas of detection theory and its fundamental measures. Its aim is to enable the reader to be able to understand and compute these measures. It concludes with a detailed analysis of a typical experiment and a discussion of some of the problems which can arise for the potential user of detection theory. The second section considers three more advanced topics: threshold theory, the extension of detection theory, and an examination of Thurstonian scaling procedures.
Trusted by 375,005 students
Access to over 1.5 million titles for a fair monthly price.
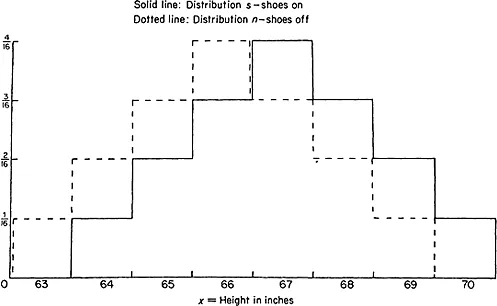
Often we must make decisions on the basis of evidence which is less than perfect. For instance, a group of people has heights ranging from 5 ft 3 in. to 5 ft 9 in. These heights are measured with the group members standing in bare feet. When each person wears shoes his height is increased by 1 inch, so that the range of heights for the group becomes 5 ft 4 in. to 5 ft 10 in. The distributions of heights for members of the group with shoes on and with shoes off are illustrated in the histograms of Figure 1.1.
FIGURE 1.1
You can see that the two histograms are identical, with the exception that s, the ‘Shoes on’ histogram, is 1 in. further up the X-axis than n, the ‘Shoes off histogram.
Given these two distributions you are told that a particular person is 5 ft 7 in. tall and from this evidence you must deduce whether the measurement was taken with shoes on or with shoes off. A look at these histograms in Figure 1.1 shows that you will not be able to make a decision which is certain to be correct. The histograms reveal that 3/16ths of the group is 5 ft 7 in. tall with shoes off and that 4/16ths of the group is 5 ft 7 in. tall with shoes on. The best bet would be to say that the subject had his shoes on when the measurement was taken. Furthermore, we can calculate the odds that this decision is correct. They will be (4/16)/(3/16), that is, 4/3 in favour of the subject having his shoes on.
You can see that with the evidence you have been given it is not possible to make a completely confident decision one way or the other. The best decision possible is a statistical one based on the odds favouring the two possibilities, and that decision will only guarantee you being correct four out of every seven choices, on the average.
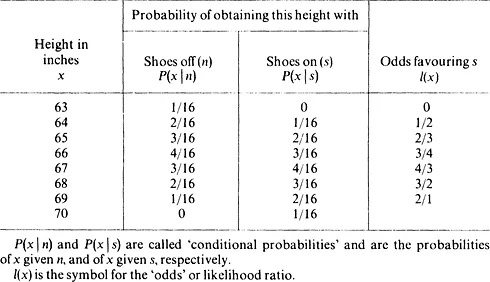
It is possible to calculate the odds that each of the eight heights
TABLE 1.1 The odds favouring the hypothesis ‘Shoes on’ for the eight possible heights of group members.
of the group was obtained with shoes on. This is done in Table 1.1. The probabilities in columns 2 and 3 have been obtained from Figure 1.1.
For the sake of brevity we will refer to the two states of affairs ‘Shoes on’ and ‘Shoes off as states s and n respectively.
It can be seen that the odds favouring hypothesis s are calculated in the following way:
For a particular height, which we will call x, we take the probability that it will occur with shoes on and divide it by the probability that it will occur with shoes off. We could, had we wished, have calculated the odds favouring hypothesis n rather than those favouring s, as has been done in Table 1.1. To do this we would have divided column 2 entries by column 3 entries and the values in column 4 would then have been the reciprocals of those which appear in the table.
Looking at the entries in column 4 you will see that as the value of x increases the odds that hypothesis s is correct become more favourable. For heights of 67 in. and above it is more likely that hypothesis s is correct. Below x=67 in. hypothesis n is more likely to be correct. If you look at Figure 1.1 you will see that from 67 in. up, the histogram for ‘Shoes on’ lies above the histogram for ‘Shoes off. Below 67 in. the ‘Shoes off histogram is higher.
SOME DEFINITIONS
With the above example in mind we will now introduce some of the terms and symbols used in signal detection theory.
The evidence variable
In the example there were two relevant things that could happen. These were state s (the subject had his shoes on) and state n (the subject had his shoes off). To decide which of these had occurred, the observer was given some evidence in the form of the height, x, of the subject. The task of the observer was to decide whether the evidence favoured hypothesis s or hypothesis n.
As you can see we denote evidence by the symbol x.1 Thus x is called the evidence variable. In the example the values of x ranged from x=63 in. to x=70 in. In a psychological experiment x can be identified with the sensory effect produced by a stimulus which may be, for example, a range of illumination levels, sound intensities, or verbal material of different kinds.
Conditional probabilities
In the example, given a particular value of the evidence variable, say x=66 in., Table 1.1 can be used to calculate two probabilities:
(a) P(x|s): that is, the probability that the evidence variable will take the value x given that state s has occurred. In terms of the example, P(x|s) is the probability that a subject is 66 in. tall given that he is wearing shoes. From Table 1.1 it can be seen that for x=66 in.,
(b) P(x|n): the probability that the evidence variable will take the value x given that state n has occurred. Table 1.1 shows that for x=66 in.,
P(x|s) and P(x|n) are called conditional probabilities because they represent the probability of one event occurring conditional on another event having occurred. In this case we have been looking at the probability of a person being 66 in. tall given that he is (or conditional on him) wearing shoes.
The likelihoo...
Table of contents
Foreword
Preface
Contents
Chapter 1 WHAT ARE STATISTICAL DECISIONS?
Chapter 2 NON-PARAMETRIC MEASURES OF SENSITIVITY
Chapter 3 GAUSSIAN DISTRIBUTIONS OF SIGNAL AND NOISE WITH EQUAL VARIANCES
Chapter 4 GAUSSIAN DISTRIBUTIONS OF SIGNAL AND NOISE WITH UNEQUAL VARIANCES
Chapter 5 CONDUCTING A RATING SCALE EXPERIMENT
Chapter 6 CHOICE THEORY APPROXIMATIONS TO SIGNAL DETECTION THEORY
Chapter 7 THRESHOLD THEORY
Chapter 8 THE LAWS OF CATEGORICAL AND COMPARATIVE JUDGEMENT
BIBLIOGRAPHY
Appendix 1 ANSWERS TO PROBLEMS
Appendix 2 LOGARITHMS
Appendix 3 INTEGRATION OF THE EXPRESSION FOR THE LOGISTIC CURVE
Appendix 4 TABLES
INDEX
Frequently asked questions
Yes, you can cancel anytime from the Subscription tab in your account settings on the Perlego website. Your subscription will stay active until the end of your current billing period. Learn how to cancel your subscription
No, books cannot be downloaded as external files, such as PDFs, for use outside of Perlego. However, you can download books within the Perlego app for offline reading on mobile or tablet. Learn how to download books offline
Perlego offers two plans: Essential and Complete
Essential is ideal for learners and professionals who enjoy exploring a wide range of subjects. Access the Essential Library with 800,000+ trusted titles and best-sellers across business, personal growth, and the humanities. Includes unlimited reading time and Standard Read Aloud voice.
Complete: Perfect for advanced learners and researchers needing full, unrestricted access. Unlock 1.5M+ books across hundreds of subjects, including academic and specialized titles. The Complete Plan also includes advanced features like Premium Read Aloud and Research Assistant.
Both plans are available with monthly, semester, or annual billing cycles.
We are an online textbook subscription service, where you can get access to an entire online library for less than the price of a single book per month. With over 1.5 million books across 990+ topics, we’ve got you covered! Learn about our mission
Look out for the read-aloud symbol on your next book to see if you can listen to it. The read-aloud tool reads text aloud for you, highlighting the text as it is being read. You can pause it, speed it up and slow it down. Learn more about Read Aloud
Yes! You can use the Perlego app on both iOS and Android devices to read anytime, anywhere — even offline. Perfect for commutes or when you’re on the go. Please note we cannot support devices running on iOS 13 and Android 7 or earlier. Learn more about using the app
Yes, you can access A Primer of Signal Detection Theory by Don McNicol in PDF and/or ePUB format, as well as other popular books in Psychology & Developmental Psychology. We have over 1.5 million books available in our catalogue for you to explore.