How do the best administrators find out how to improve their schools? They actively engage the people who work and study there. In From Questions to Actions: Using Questionnaire Data for Continuous School Improvement, data experts Victoria L. Bernhardt and Bradley J. Geise explain how to collect and analyze data with an eye toward positive change. In addition to gaining an overview of the questionnaire process, you'll learn to:
- Start with Your Survey's Purpose
- Create Questionnaires That Get Valuable Answers
- Properly Analyze Data
- Share Results in a Dynamic Way
- Use meaningful data to understand the needs of teachers and students, then implement targeted improvement plans.
Let Bernhardt and Geise lead the way!
eBook - ePub
From Questions to Actions
Using Questionnaire Data for Continuous School Improvement
- 208 pages
- English
- ePUB (mobile friendly)
- Available on iOS & Android
eBook - ePub
From Questions to Actions
Using Questionnaire Data for Continuous School Improvement
About this book
Trusted by 375,005 students
Access to over 1 million titles for a fair monthly price.
Study more efficiently using our study tools.
Information
Topic
EducationSubtopic
Education GeneralCHAPTER 1
UNDERSTANDING THE ROLE OF PERCEPTIONS DATA IN COMPREHENSIVE DATA ANALYSIS
This chapter describes how perceptions work with demographic, student learning, and school process data to help schools determine what needs to change in order to improve learning for all students.
In well over a thousand data analysis workshops, Education for the Future presenters have asked participants if they believe perceptions are important to know within the context of school improvement. We always get a resounding YES!! When asked why, workshop participants give responses similar to— “the public’s perception determines whom we can get as students in our schools, and how much the public will help us”; “perceptions are people’s reality”; and “we all have expectations and preconceived notions that determine how we act.”
All of us have perceptions of the way the world in which we live operates. We act upon these perceptions every day as if they are reality. Generally, we act in congruence with what we value, believe, and perceive.
It is important to know what others perceive—particularly students, staffs, and parents who attend, teach in, and support our schools. All of us have perceptions of the way the world in which we live operates. We act upon these perceptions every day as if they are reality. Generally, we act in congruence with what we value, believe, and perceive.
The definitions of perception and its synonyms provide almost enough information to understand why it is important to know the perceptions of our students, teachers, administrators, parents, and—when appropriate— members of our communities.
The word perception leads us to such words as “observation” and “opinion,” with definitions that include—
♦a view, judgment, or appraisal formed in the mind about a particular matter
♦a belief stronger than impression and less strong than positive knowledge
♦a generally held view
♦a formal expression of judgment or advice
♦a judgment one holds as true
Synonyms include opinion, view, belief, conviction, persuasion, and sentiment.
♦Opinion implies a conclusion thought out yet open to dispute.
♦View suggests a subjective opinion.
♦Belief implies often deliberate acceptance and intellectual assent.
♦Conviction applies to a firmly and seriously held belief.
♦Persuasion suggests a belief grounded on assurance (as by evidence) of its truth.
♦Sentiment suggests a settled opinion reflective of one’s feelings.
In organizations, if we want to know what is possible... we need to know the perceptions of the people who make up the organization.
Generally, we do not act differently from what we value, believe, or perceive. In organizations, if we want to know what is possible (i.e., if we want to know how others are perceiving what is possible), we need to know the perceptions of the people who make up the organization.
Gathering perceptions data can help us understand—
♦Values and beliefs—what do teachers and staff believe will impact student learning and get all staff moving forward?
♦Shared vision—are all teachers and staff on the same page, and do they know where they are going?
♦Organizational culture and climate—how do school personnel work, and what needs to change to get everyone moving forward together?
♦Strategies that will help students learn—what instructional and assessment strategies are being used, and are they working?
♦Teacher behavior—what is actually being done—if teachers do not believe certain actions will improve student learning, they will not implement them.
♦What is important to students—what do students believe has to be in place in order for them to learn?
PERCEPTIONS DATA IN THE CONTEXT OF DATA-DRIVEN DECISION MAKING AND CONTINUOUS IMPROVEMENT
Many schools in the United States believe they are being data driven when they analyze their annual summative student achievement test results—only. Schools know that disaggregating and analyzing student achievement results are extremely important and informative. However, using summative student achievement results alone can lead schools to implement short-term fixes. We see schools adding before-school programs, after-school programs, and remediation for the students not achieving. While these strategies could lead to immediate gains for some students, these “fixes” might imply that the strategies being used during the school day do not need to change, merely that we need to get the non-achieving students to “our” level of instruction. In effect, we are telling students who are having difficulty learning to sit quietly in their seats during class; we will attend to their learning needs after the achieving students have completed the day’s assignments.
To understand what needs to change to get different results, schools need to analyze their demographic and school process data in conjunction with their student achievement and perceptual results.
We want schools to provide strategies that will meet the needs of all students all of the time. To understand what needs to change to get different results, schools need to analyze their demographic and school process data in conjunction with their student achievement and perceptual results. In that way, each school will get a complete picture of the most quantifiable elements of the learning organization. Figure 1.1 shows these four categories of data and how they intersect to provide a complete picture of a learning organization. Understanding where a school is with respect to each of these categories and their intersections will inform schools where they are now and what they need to do to get different results. Analyses of these data can also tell schools if they are progressing to where they want to be.
MULTIPLE MEASURES OF DATA
Demographic data provide the context and show the structure of the school. Demographic data are powerful components of comprehensive data analysis; however, these data are often overlooked in data analysis. Demographics can begin to tell us about how students are treated and served (e.g., discipline, special education identification, gifted and Advanced Placement [AP] class enrollments, attendance, all by gender and ethnicity). Demographics can be corroborated with perceptions data (how students feel about how they are treated and served).
Perceptions data tell us what students (current and former) are thinking and feeling about the school and other important elements, such as what students believe has to be in place in order for them to learn. Additionally, perceptions can tell us what staffs are thinking and feeling about the learning environment; and, in the long run, what is possible with school improvement. For example, if staffs believe that the leadership does not support teachers in sharing and implementing a vision and that staffs do not work together to create a continuum of learning that makes sense for students, there is no plan that can be implemented that will create a continuum of learning for students until all staff members commit to the vision and determine how to work collaboratively with each other.
Student learning data tell schools how students perform at a given point in time on a specific measurement tool. If the formative and summative assessments measure what the school expects students to know and be able to do, when intersected with demographics and school process data, these data can tell teachers which strategies are working with which groups of students, and which processes are not working with which student groups. Listening to students’ perceptions of the learning processes and the assessments can help teachers understand how to change their instructional strategies to get different results.
Figure 1.1
MULTIPLE MEASURES OF DATA
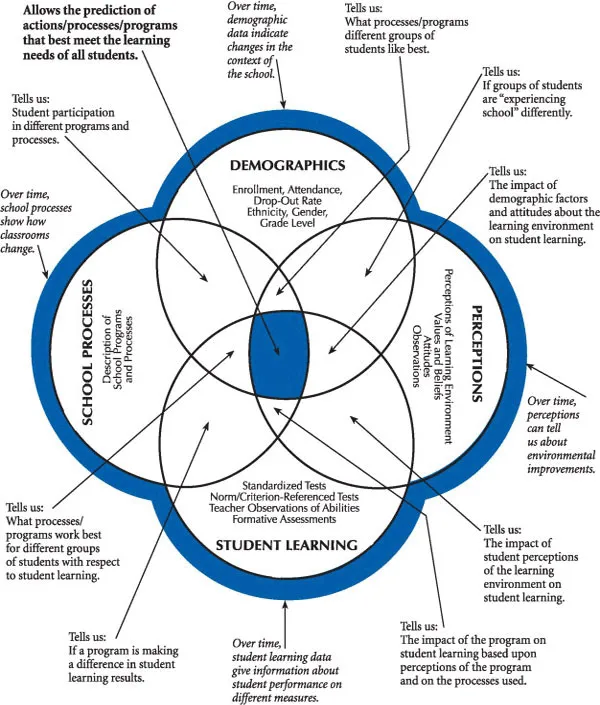
School process data tell us what programs are in place, and what and how instructional and assessment strategies are being implemented on behalf of students. Combined with demographic data, school process data can tell us about equality of access. Intersected, perceptions and school process data can inform us of what students are thinking and feeling about how they are being taught and how they prefer to learn, which can provide insight into how to change instructional strategies to meet students’ learning needs. Intersected with student learning data, process data can tell us which instructional strategies or processes are working.
If we want to understand how to improve services for all students, perceptions data just might provide the ticket to improvement.
Together these four measures—demographics, perceptions, student learning, and school processes—help us see clearly whom we have as students, how they are being served, and the results the school is getting based on the way students are being served. If we want to understand how to improve services for all students, perceptions data just might provide the ticket to improvement.
CHANGING PERCEPTIONS
Is it possible to change perceptions? Absolutely. How do we get perceptions to change? The most effective way to change perceptions is through behavior changes. That means if some teachers do not believe in a strategy the majority of staff wants to take in all classrooms, one way to change their minds is to increase their understanding of the strategy and give them an opportunity to experience it. Awareness and experience can lead to basic shifts in opinions and beliefs, followed by shifts in attitudes. This is why staffs must include powerful professional learning designs (e.g., coaching, demonstration lessons, collaboration) in their continuous improvement plans. This is also why many schools have parent nights when there is a change in math, technolog...
Table of contents
- Cover
- Title Page
- Copyright Page
- Acknowledgements
- About The Authors
- Table of Contents
- Preface
- 1. Understanding The Role Of Perceptions Data In Comprehensive Data Analysis
- 2. Measuring Perceptions With Questionnaires: A Process Overview
- 3. Developing Effective Questionnaires
- 4. Collecting Questionnaire Responses From Staffs, Students, And Parents
- 5. Analyzing Questionnaire Data
- 6. Presenting Questionnaire Results
- 7. Using Questionnaire Results
- 8. Integrating Questionnaire Findings Into Data Analysis: An Example
- 9. Education For The Future Questionnaires: From Development To Use
- 10. Pulling It All Together
- Appendix: Education For The Future Questionnaires
- References And Resources
- Index
Frequently asked questions
Yes, you can cancel anytime from the Subscription tab in your account settings on the Perlego website. Your subscription will stay active until the end of your current billing period. Learn how to cancel your subscription
No, books cannot be downloaded as external files, such as PDFs, for use outside of Perlego. However, you can download books within the Perlego app for offline reading on mobile or tablet. Learn how to download books offline
Perlego offers two plans: Essential and Complete
- Essential is ideal for learners and professionals who enjoy exploring a wide range of subjects. Access the Essential Library with 800,000+ trusted titles and best-sellers across business, personal growth, and the humanities. Includes unlimited reading time and Standard Read Aloud voice.
- Complete: Perfect for advanced learners and researchers needing full, unrestricted access. Unlock 1.4M+ books across hundreds of subjects, including academic and specialized titles. The Complete Plan also includes advanced features like Premium Read Aloud and Research Assistant.
We are an online textbook subscription service, where you can get access to an entire online library for less than the price of a single book per month. With over 1 million books across 990+ topics, we’ve got you covered! Learn about our mission
Look out for the read-aloud symbol on your next book to see if you can listen to it. The read-aloud tool reads text aloud for you, highlighting the text as it is being read. You can pause it, speed it up and slow it down. Learn more about Read Aloud
Yes! You can use the Perlego app on both iOS and Android devices to read anytime, anywhere — even offline. Perfect for commutes or when you’re on the go.
Please note we cannot support devices running on iOS 13 and Android 7 or earlier. Learn more about using the app
Please note we cannot support devices running on iOS 13 and Android 7 or earlier. Learn more about using the app
Yes, you can access From Questions to Actions by Victoria Bernhardt,Bradley Geise in PDF and/or ePUB format, as well as other popular books in Education & Education General. We have over one million books available in our catalogue for you to explore.