1.1 FROM AERIAL PHOTOGRAPHY TO REMOTE SENSING
Photography from aerial platforms was initially conducted using ornithopters, balloons, kites, pigeons, and gliders (Jensen 2006). In 1908, 5 years after the Wright brothers built the world’s first operational aircraft, an aircraft was first used as a platform for aerial photography. During World War I and World War II, aerial photography played an important role as a military photo-reconnaissance method. In the 1920s and 1930s, aerial photography became the standard information source for the compilation of topographic maps. From the 1930s until the early 1960s, black-and-white, color, and color-infrared aerial photographs were widely utilized by geologists, foresters, and planners for interpreting the Earth’s surface features (van Nowhuys 1937, Melton 1945, Desjardins 1950, Miller 1961). The use of aerial photographs improves the efficiency of many mapping applications because (1) aerial photographs make it possible for mapping ground features in areas where field investigation is difficult due to poor accessibility; (2) stereo aerial photographs help the interpretation of ground features through incorporation of topographic information; and (3) color-infrared aerial photographs provide spectral information beyond human vision. The main drawbacks of early aerial photographs were that (1) aerial photograph acquisition depended on the weather and (2) aerial photographs were normally recorded in an analog format and were not calibrated, which precludes quantitative analysis.
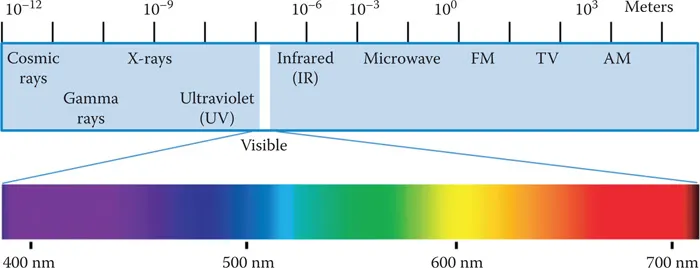
The term “remote sensing” was first coined by Evelyn Pruitt of the U.S. Office of Naval Research in the 1950s, and the traditional aerial photography gradually evolved into remote sensing around 1960. Sabins (1987) defined remote sensing as methods that employ electromagnetic energy to detect, record, and measure the characteristics of a target, such as the Earth’s surface. Although many other definitions of remote sensing exist in literature (Colwell 1984, Fussell et al. 1986, Jensen 2006), it is commonly accepted that the basis for remote sensing is the electromagnetic spectrum (Figure 1.1). Since the late 1960s and early 1970s, many traditional aerial photographic systems have been replaced by airborne and spaceborne electro-optical and electronic sensor systems. While traditional aerial photography mainly works in visible bands, modern spaceborne, airborne, and ground-based remote sensing systems produce digital data that covers visible, reflected infrared, thermal infrared, and microwave spectral regions with different spatial, spectral, temporal, and radiometric resolutions. Traditional visual interpretation methods in aerial photography are still useful, but remote sensing encompasses more activities such as theoretical modeling of target properties, spectral measurement of objects, and digital image analysis for information extraction.
FIGURE 1.1 The electromagnetic spectrum. The numbers show wavelengths of spectral regions.
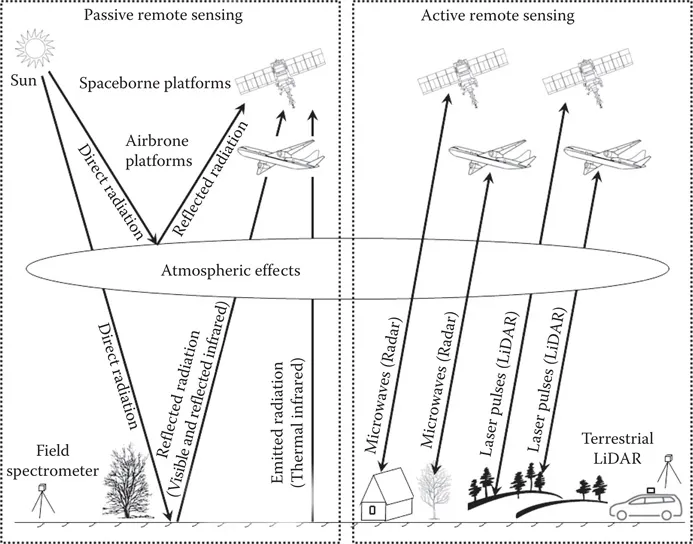
FIGURE 1.2 Passive and active remote sensing.
There are two types of remote sensing systems: passive and active (Figure 1.2). Passive remote sensing systems measure reflected solar radiation in visible, near-infrared, and mid-infrared wavelengths, or absorbed and then reemitted solar radiation in thermal infrared wavelengths. Active remote sensing systems, on the other hand, emit radiation toward the target using their own energy source and detect the radiation reflected from that target. An important advantage for active sensors is their ability to obtain measurements independently of sun illumination conditions and largely independent of weather conditions. The following sections provide an overview of two passive remote sensing methods—multispectral remote sensing and hyperspectral remote sensing—and two active remote sensing methods—radar remote sensing and light detection and ranging (LiDAR) remote sensing.
1.2 MULTISPECTRAL REMOTE SENSING
In multispectral remote sensing, visible and reflected infrared (near infrared and mid-infrared) images are collected by recording the reflection of solar radiation from the earth using airborne and spaceborne sensors, whereas thermal infrared images are collected by recording emitted thermal radiation from the earth. An early example of airborne visible and reflected infrared sensors is the Airborne Thematic Mapper (ATM), an eleven-band prototype of the Thematic Mapper (TM) of the Landsat-4 satellite. In additional to airborne visible and reflected infrared multispectral sensors, airborne thermal infrared sensors also provide important data for many applications, especially geologic mapping and mineral exploration. Hunt (1980) reported that silicates exhibit fundamental vibrational stretching modes in the 10 μm region. The reflection peak at or near the fundamental vibration frequency is called the reststrahlen or residual ray peak (Goetz 1989). Kahle (1984) reported that the absorption features of silicate rocks shift toward longer wavelengths with the decrease of silica content from quartzite through basalt. Since silicates make up the bulk of the crustal rocks, and the fundamental vibrational features of silicates are located in the 8–14 μm atmospheric transmission window, an emissivity minimum resulted from the reststrahlen can be detected with multispectral sensors. Kahle and Rowan (1980) used multispectral thermal data from a Bendix 24-channel scanner for lithological mapping in the East Tintic Mountains in central Utah, USA. Their study showed that it is possible to discriminate among several rock types primarily based on their silica content. Since the spectral properties of minerals may be quite different in visible and reflected infrared region, it is possible to discriminate among carbonate rocks, quartzite, quartz latitic and quartz monzonitic rocks, latitic and monzonitic rocks, silicified altered rocks, and argillized altered, if multispectral thermal data are combined with visible and reflected infrared data (Goetz 1989). The study by Kahle and Rowan (1980) provided the justification for the development of a multispectral scanner working in the thermal infrared region (Goetz 1989). In the early 1980s, the Thermal Infrared Multispectral Scanner (TIMS) was developed in the United States for remote sensing of non-renewable resources. The TIMS instrument collects thermal emission energy in six bands near the peak of the Earth’s surface emission (8.2–8.6, 8.6–9.0, 9.0–9.4, 9.4–10.2, 10.2–11.2, and 11.2–12.2 μm). Using TIMS data, Kahle and Goetz (1983) showed that it was possible to map quartz-bearing rocks. Gillespie et al. (1984) used TIMS data to map alluvial fans in Death Valley, California, and found that both composition and relative age were recognizable.
The use of airborne visible, reflected infrared, and thermal infrared sensors has a number of benefits. The user can select the wavebands of interest in a particular application, and the aircraft can be flown to specific user requirements concerning time of day, flying direction, and spatial resolution. However, data acquisition using airborne systems is expensive compared with satellite recording, as aircraft missions are generally flown for a single user and do not benefit from the synoptic view available to satellite platforms.
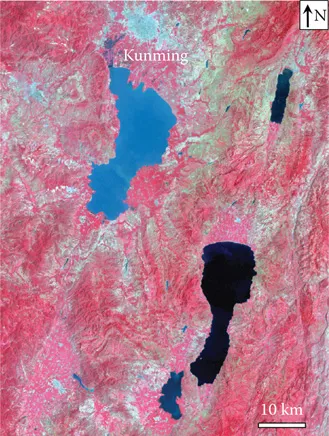
A new era of spaceborne remote sensing began when the Explorer VI of the United States obtained the first satellite picture of the Earth in August 1959 (European Space Agency 2014). From 1959 to 1972, Corona satellites of the United States were used for photographic surveillance. Civilian applications of satellite remote sensing began with the National Aeronautics and Space Administration’s (NASA) Landsat series. Since 1972, NASA has lunched Landsat 1 (1972), Landsat 2 (1975), Landsat 3 (1978), Landsat 4 (1982), Landsat 5 (1984), Landsat 6 (1993, failed to reach orbit), Landsat 7 (1999), and Landsat 8 (2013). The multispectral scanner and return-beam vidicon were the imaging systems in the first generation of Landsat (then called ERTS-1). The second generation of Landsat (Landsats 4 and 5) includes an MSS imaging system and a new sensor, the Thematic Mapper. The third generation of Landsat (Landsats 6 and 7) includes an Enhanced Thematic Mapper Plus (ETM+). A review of the three decades of Landsat instruments (Landsat 1–7) can be found in the works of Mika (1997). Landsat 8 launched on February 11, 2013 and was developed as a collaboration between NASA and the U.S. Geological Survey. With two science instruments—the Operational Land Imager (OLI) and the Thermal Infrared Sensor (TIRS)—Landsat 8 represents an evolutionary advance in technology. OLI provides two new spectral bands, one for detecting cirrus clouds and the other for coastal zone observation. TIRS has two narrow spectral bands in the thermal region which was formerly covered by one wide spectral band on Landsats 4–7. The Landsat satellite series are a great contribution to remote sensing. In fact, it is the MSS aboard the first Landsat that gives most earth scientists their first look at images taken in a spectral region beyond that seen by human eyes. Other multispectral remote sensing satellites launched during this period include the Système Probatoire d’Observation de la Terre (SPOT) series developed by France—SPOT-1 (1986), SPOT-2 (1990), SPOT 3 (1993), SPOT4 (1998), SPOT 5 (2002), and SPOT 6 (2012); the India Remote Sensing Satellite (IRS) series started in 1988; the China-Brazil Earth Resource Satellite series started in 1999; and high-resolution satellites such as IKONOS (1999), QuickBird (2001), WorldView-1 (2007), GeoEye-1 (2008), WorldView-2 (2009), and China’s Gaofen (high resolution) satellite series started in 2013, among others. Multispectral data collected by these spaceborne platforms have been widely used in many application fields. Figure 1.3 is a color composite of Landsat-5 TM bands 4 (red), 3 (green), and 2 (blue) acquired on August 16, 1992, near Kunming, Yunnan, China.
1.3 HYPERSPECTRAL REMOTE SENSING
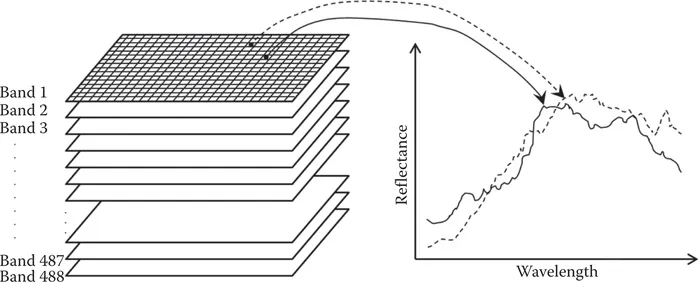
Compared with multispectral remote sensing that uses relatively broad spectral bands, hyperspectral remote sensing uses imaging spectrometers that measure near-laboratory-quality spectra in narrow spectral bands. Therefore, a complete reflectance spectrum can be derived from the spectral bands for every pixel in the scene (Figure 1.4). It should be noted that there is no absolute threshold on the number of bands that distinguish between multispectral and hyperspectral remote sensing.
FIGURE 1.3 Color composite of Landsat-5 TM bands 4 (red), 3 (green), and 2 (blue) acquired on August 16, 1992, near Kunming, Yunnan, China.
FIGURE 1.4 The imaging spectrometry concept. A spectral curve can be extracted from hundreds of spectral bands for each pixel location.
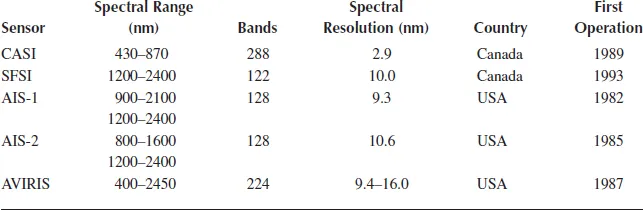
The Airborne Imaging Spectrometer (AIS) was the first of the high-resolution imaging spectrometers (Goetz et al. 1985a). The success of the AIS gave impetus to the development of an improved optical sensor, the Airborne Visible and Infrared Imaging Spectrometer (AVIRIS), which delivers calibrated images of 224 contiguous spectral channels within the wavelengths ranging from 400 to 2450 nanometers (nm) (Vane and Goetz 1993). Table 1.1 lists the configuration of five early airborne imaging spectrometers.
TABLE 1.1
Configuration of Five Airborne Imaging Spectrometers
The launch of NASA’s Earth Observing-1 (EO-1) platform in November 2000 marks the first operational test of NASA’s “New Millennium” spaceborne hyperspectral technology for Earth observation. The theme of the EO-1 mission is the evaluation of advanced earth observation instruments through a combination of direct measurements of performanc...