A greatly expanded and heavily revised second edition, this popular guide provides instructions and clear examples for running analyses of variance (ANOVA) and several other related statistical tests of significance with SPSS. No other guide offers the program statements required for the more advanced tests in analysis of variance. All of the programs in the book can be run using any version of SPSS, including versions 11 and 11.5. A table at the end of the preface indicates where each type of analysis (e.g., simple comparisons) can be found for each type of design (e.g., mixed two-factor design).
Providing comprehensive coverage of the basic and advanced topics in ANOVA, this is the only book available that provides extensive coverage of SPSS syntax, including the commands and subcommands that tell SPSS what to do, as well as the pull-down menu point-and-click method (PAC). Detailed explanation of the syntax, including what is necessary, desired, and optional helps ensure that users can validate the analysis being performed. The book features the output of each design along with a complete explanation of the related printout.
The new edition was reorganized to provide all analysis related to one design type in the same chapter. It now features expanded coverage of analysis of covariance (ANCOVA) and mixed designs, new chapters on designs with random factors, multivariate designs, syntax used in PAC, and all new examples of output with complete explanations. The new edition is accompanied by downloadable resources with all of the book's data sets, as well as exercises for each chapter.
This book is ideal for readers familiar with the basic concepts of the ANOVA technique including both practicing researchers and data analysts, as well as advanced students learning analysis of variance.
Trusted by 375,005 students
Access to over 1.5 million titles for a fair monthly price.
This book explains how to perform numerous variants of a certain type of highly useful and common statistical analysis called analysis of variance (frequently shortened to ANOVA) using the SPSS computer software package, one of the most widely used and taught statistical software programs. As mentioned in the Preface, SPSS is available for several different platforms, including Windows, mainframe, and Macintosh versions, and knowledge of how SPSS is to be accessed is necessary and will not be provided here. It is assumed instead that the user will obtain the necessary information to access SPSS at the site where the program is to be run.
CONVENTIONS FOR SYNTAX PROGRAMS
The syntax programs provided in this book can be run on any of the previously mentioned computer platforms (except the student version of Windows, which does not allow syntax programming). The creation and editing of SPSS syntax programs depends on the platform and, for mainframe users, on the details of the installation and operating system. For Windows users, creation and editing of SPSS syntax programs is described near the end of the present chapter. Each syntax program presented is followed by an explanation of the different lines (or commands) in the program. The following conventions are used in this book when presenting syntax programs: The program commands and SPSS keywords are all presented in capital letters (however, they do not actually need to be typed as capital letters in order to operate properly).1 The parts of any command or subcommand that are specific to a data set or analysis, in contrast, are all in lower case letters. It is assumed that a <RETURN> (or <ENTER>, depending upon the keyboard) will follow each command (i.e., program statement). These <RETURN>s are omitted in all figures in the book.
The numbers in the figures that precede each of the program statements are line numbers and are there only for reference within this text—you should not type them in. A lowercase o next to a line number indicates that that line is optional; if there is a lowercase d next to a line number, that line is also optional, but highly desirable.
A syntax program generally consists of both commands and subcommands and the specifications for each. In SPSS, any information that begins in the first column of a line begins a new command. Thus, any command that continues beyond one line must be indented (typically two or more indented spaces are apparent to the programmer). Subcommands always begin with a forward slash (/ ). They can follow on the same line as the command to which they refer or be put on separate lines (as long as you indent on every new line). (Note that it is usually clearer to put subcommands on separate lines, as is the convention in this book.) SPSS commands and subcommands and their placement will become clearer as you see more examples in this book. In the programs presented here, SPSS commands end with a period; if a command is followed by a series of subcommands, the period is placed after the final subcommand. On some mainframe programs, this command terminator is not used. Check with your local mainframe staff about this. SPSS for Windows commands must end with a period.
Within the text descriptions of the programs, when we refer to a specific command or subcommand keyword, we capitalize and put it in double quotes. An exception is when we refer to something the programs do (e.g., MANOVA) rather than referring to them as a command: In the former case we simply capitalize. We also put any wording that is a direct quote from the output in double quotes (using the same combination of cases seen in the output). We use single quotes when we are referring to specifications for a command (or subcommand) that refers to some specific variable(s) in your data set. When we refer to commands in PAC, we use the exact combination of cases that is seen on the screen.
CREATING SYNTAX PROGRAMS IN WINDOWS
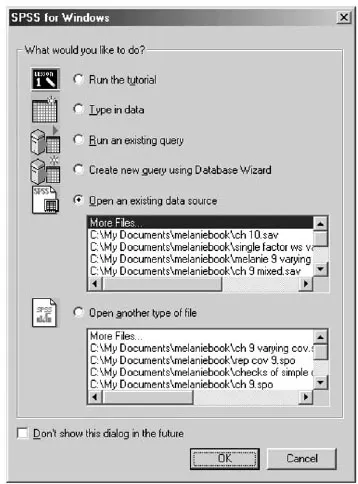
For Windows users, we describe how to create syntax programs here. First, open SPSS by clicking on its icon (and if necessary clicking cancel or the
at the top of the screen shown in Fig. 1.1).
FIG. 1.1. Opening window when SPSS for Windows is accessed.
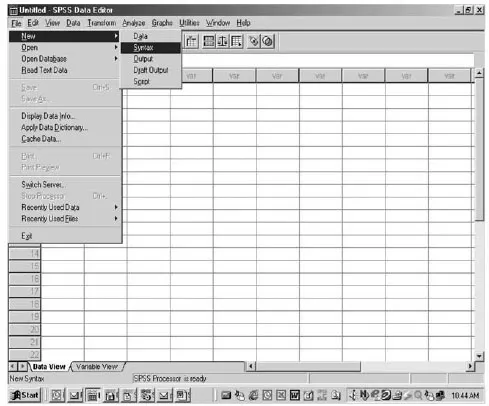
To begin writing syntax, click on File, then New, then Syntax (in future discussion, such click sequences will have a long dash between click options of the menus, as in File-New-Syntax), as seen in Fig. 1.2.
FIG. 1.2. Opening a new Syntax window.
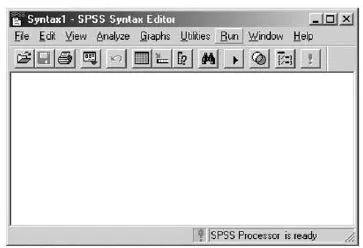
This will open up a new syntax window that looks like the one in Fig. 1.3.
FIG. 1.3. Blank Syntax window.
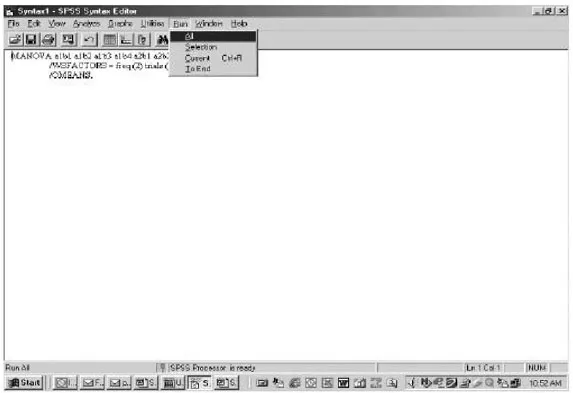
You may now begin typing in the commands and subcommands that comprise SPSS programs into the window, as described in the following chapters. Assume that the three lines seen in Fig. 1.4 were typed in by you, and constituted all that you wished to enter. You would then click on Run-All, as pictured in Fig. 1.4, to obtain the data analysis (you could also highlight all of the text and then click on the small arrow seen near the right side of the toolbar in Fig. 1.3).
FIG. 1.4. Using Run-All.
The remaining chapters use these conventions and syntax to ready data for analysis and to conduct the analysis by ANOVA or related techniques.
1For the sake of economy, the initial word of every command, subcommand, or keyword in SPSS can be safely abbreviated to the first four characters. Thus, a keyword introduced in the next chapter is “DIFFERENCE”, which could be abbreviated as “DIFF”. In this book, however, the full spelling is always used.
2 Reading in and Transforming Variables for Analysis in SPSS
Before any data can be analyzed by SPSS with the technique termed analysis of variance (ANOVA), the data to be analyzed must be introduced to, or entered into, SPSS. Subsequent chapters explain how to perform the several variants of ANOVA presuming that the data are already entered. This chapter’s focus is to provide information on how to get the variables into SPSS beforehand. Methods for reading in or directly entering the data are described, as well as those for performing simple data transformations (e.g., computing an average).
READING IN DATA WITH SYNTAX
Before examining the syntax in Fig. 2.1, the reader is strongly advised to reread the syntax conventions discussed in the previous chapter. For example, the line numbers are not to be typed in.
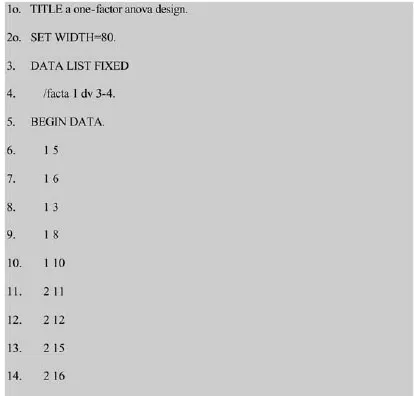
FIG. 2.1. Syntax commands to read in data.
The first statement in Fig. 2.1, “TITLE”, is an optional command (i.e., it is perfectly acceptable to leave it off; note the o beside the line number) that allows the user to specify a title in the printout. You decide what the title should be. In this example, ‘a one-factor anova design’ was used. The title does not in any way affect the analysis. It will simply appear at the top of each page of the printout. The space between the command “TITLE” and the actual title is required. If you wish to use a long descriptive title, you may continue the title on the next line. To do this, simply indent the second line one space. However, SPSS will only repeat the first 60 letters of the title at the top of every page. Additional descriptive information can be added to the top of every page with the “SUBTITLE” command. The “SUBTITLE” command is placed on the line following the “TITLE” command, with the actual subtitle separated from the “SUBTITLE” command by a space as follows:
SUBTITLE example from chapter 2 of Page et al.
By default on many platforms, SPSS prints the results or output of your requested analyses on lines that are 132 characters wide. The optional command on line 2 reduces the size of the output to 80 columns, which will make it easier for you to see the entire output on your computer screen and, moreover, the output will fit on an 8.5– × 11–in. piece of paper. In SPSS for Windows, this control over output size is given on Edit-Options-Viewer (or Draft Viewer); then click the desired alternative on Text Output.
Entering Data with the “DATA LIST” Command
One of the most crucial steps in programming is telling the statistical package how to “read” your data file. There are several ways to do this, including, in Windows, typing values directly into the Data Editor Window, which is described later. The most general method, available to both nonWindows and Windows users, is through the use of syntax, specifically the “DATA LIST” command on line 3 in Fig. 2.1, which tells SPSS (a) where the data are and (b) what value to give each variable (or measure, or score) for each participant. If you have a very small data set, you may want to type the data within the SPSS program, as was done in the example of Fig. 2.1. If your data set is large, however, you may prefer to type the data in another file called an external file (a separate file of just data), which you will read into the program with the “DATA LIST” command, to be described later in this chapter.
The first example, however, assumes that the data are within the SPSS program, as in the example in Fig. 2.1. As seen in line 3, the command “DATA LIST” is followed by a keyword describing the type of format of the data, “FIXED” or “FREE” (more on this later). This line is followed by a subcommand (here in line 4; recall, however, that subcommands need not be on different lines) that provides the names you wish to give the variables and, for “FIXED” format, their column locations. Thus, this subcommand will tell SPSS which variables are in which columns for “FIXED” or in which order for “FREE”. In this example of “FIXED”, as will be explained in more detail later, line 4 specifies that the variable to be called ‘facta’ is in column 1 and the variable to be called ‘dv’ is in columns 3 and 4. Because, in this example, the data are included in the program,...
Table of contents
Cover
Title Page
Copyright Page
Contents
PREFACE
1 Using SPSS and Using This Book
2 Reading in and Transforming Variables for Analysis in SPSS
3 One-Factor Between-Subjects Analysis of Variance
4 Two-Factor Between-Subjects Analysis of Variance
5 Three (and Greater) Factor Between-Subjects Analysis of Variance
6 One-Factor Within-Subjects Analysis of Variance
7 Two (or More) Factor Within-Subjects Analysis of Variance
8 Two-Factor Mixed Designs in Analysis of Variance: One Between-Subjects Factor and One Within-Subjects Factor
9 Three- (or Greater) Factor Mixed Designs
10 Analysis of Covariance
11 Designs With Random Factors
12 Multivariate Analysis of Variance: Designs With Multiple Dependent Variables Tested Simultaneously
13 GLM and UNIANOVA Syntax
REFERENCES
APPENDIX A
APPENDIX B
Author Index
Subject Index
Frequently asked questions
Yes, you can cancel anytime from the Subscription tab in your account settings on the Perlego website. Your subscription will stay active until the end of your current billing period. Learn how to cancel your subscription
No, books cannot be downloaded as external files, such as PDFs, for use outside of Perlego. However, you can download books within the Perlego app for offline reading on mobile or tablet. Learn how to download books offline
We are an online textbook subscription service, where you can get access to an entire online library for less than the price of a single book per month. With over 1.5 million books across 990+ topics, we’ve got you covered! Learn about our mission
Look out for the read-aloud symbol on your next book to see if you can listen to it. The read-aloud tool reads text aloud for you, highlighting the text as it is being read. You can pause it, speed it up and slow it down. Learn more about Read Aloud
Yes! You can use the Perlego app on both iOS and Android devices to read anytime, anywhere — even offline. Perfect for commutes or when you’re on the go. Please note we cannot support devices running on iOS 13 and Android 7 or earlier. Learn more about using the app
Yes, you can access Levine's Guide to SPSS for Analysis of Variance by Sanford L. Braver,David P. MacKinnon,Melanie Page in PDF and/or ePUB format, as well as other popular books in Psychology & Research & Methodology in Psychology. We have over 1.5 million books available in our catalogue for you to explore.