This book offers examples of programs designed for analysis of variance and related statistical tests of significance that can be run with SPSS. The reader may copy these programs directly, changing only the names or numbers of levels of factors according to individual needs. Ways of altering command specifications to fit situations with larger numbers of factors are discussed and illustrated, as are ways of combining program statements to request a variety of analyses in the same program.
The first two chapters provide an introduction to the use of SPSS, Versions 3 and 4. General rules concerning the use of commands, subcommands, and keywords are discussed, providing a specific introduction to the use of SPSS for analysis of variance. They provide detailed programs for obtaining omnibus F tests in completely randomized designs and for designs that include repeated measures factors. The remaining chapters may be read independently and in any order.
- 176 pages
- English
- ePUB (mobile friendly)
- Available on iOS & Android
eBook - ePub
A Guide to SPSS for Analysis of Variance
About this book
Trusted by 375,005 students
Access to over 1.5 million titles for a fair monthly price.
Study more efficiently using our study tools.
Information
1 Basic Commands and Omnibus F Tests for Completely Randomized Designs
This chapter has a dual role: to explain the use of relevant program commands, and to offer sets of program statements for omnibus F tests in completely randomized designs. Therefore this chapter includes general discussion of how to use SPSS, along with the illustrations of the statements needed for specific completely randomized designs. The assumption is made that SPSS has been accessed from the main frame, so only the statements within the SPSS program are displayed in the examples.
Basic Analysis of Variance Commands
The basic analysis of variance commands will be presented in capital letters. It wil be useful to begin by displaying a set of hypothetical data from three groups of subjects, following that with a sample program for analyzing the data with the analysis of variance statistic. The data appear in Fig. 1.1.
In the example presented in rig. 1.1, ditlerent subjects are assumed in each of the three groups, with just one factor in the design, and observations on one variable. A design with one factor and different subjects in the different groups is usually identified as a completely randomized one factor analysis of variance, which the SPSS program calls up with the command ONEWAY.
The program, presented below in Fig. 1.2, is followed with an explanation of the function of the different commands in the program, and the variations in the commands that might be found useful. The commands that are to be typed into the computer will all be presented below in capital
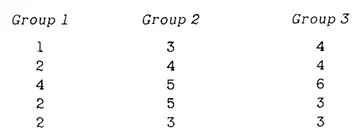
FIG. 1.1. Hypothetical data for a one factor completely randomized design, with five subjects in each group.
letters (although they do not have to be typed as upper case). It is assumed that a key press will follow each command (each program statement), to enter each command, using either a specific (ENTER) key, or a (RETURN) key (the key used differing with different computer facilities and keyboards). These (ENTER) presses are omitted in Fig. 1.2 and subsequent illustrations of programs. The numbers in the figures that precede each of the program statements are there only for easy reference within this text.
The first statement in Fig. 1.2, TITLE, is an optional command that is used for easy identification of different programs you might be running. The command TITLE tells the computer that what follows on that line is the title that you will want to see in the printout. What you write on that line is only for your information, and does not affect the analysis. It is necessary that a space separates the command TITLE from the actual title. In the printout you will then see that line appearing, minus the word TITLE, on the top of the pages of the printout. If you wish to use a long
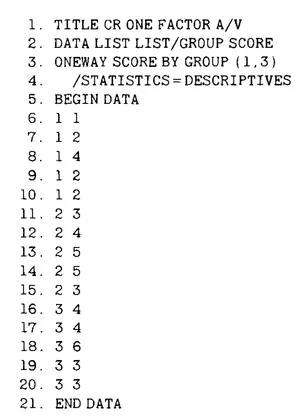
FIG. 1.2. Program for a completely randomized one factor analysis of variance.
descriptive title that will identify the program for you in some detailed fashion, you may have to continue the title on the next line. To do this, simply indent the second line one space. However, SPSS will only repeat the first sixty letters of the title at the top of every page; the full title only appearing where the program itself is reproduced. The way to add additional descriptive information to the top of every page is to use the SUBTITLE command. This command is entered in the same way as the TITLE command. It is placed on the line following the TITLE command, with the actual subtitle separated from the SUBTITLE command by a space. For example,

will produce, as a second line of description at the top of every page of the printout, the words EXAMPLE FROM THE MANUAL.
Look at the second program statement. The first part of the line,

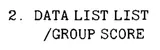
is always used in an SPSS analysis of variance program. The rest of the line involves options that can change from one version of the program to another. The specifications in the DATA LIST statement are discussed further in the following paragraphs. The specifications can be sufficiently extensive to require a second line. If this is the case, you simply indent at least one space on the continuing line. For example, statement 2 from Fig. 1.2 can be typed in either of the two following ways:
or
Using Stored Data
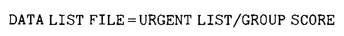
If the data are already stored in the computer, and do not have to be entered with the program, you have to identify your data file so that it can be retrieved. This is done with the FILE subcommand of the DATA LIST command. For example, if your data file was named URGENT, your DATA LIST program statement would look like the following:
However, the particular computer and its operating system will probably require additional specifications for locating and retrieving the program from within the system. Such information can only be obtained at the local computer site. It would consist of some additional specifications within the DATA LIST program statement. This is the only line within the set of SPSS program statements that will vary with the computer facilities. Variations in that one statement are less likely to be needed when the data is included with the SPSS program statements. Consequently, in this manual, it is assumed that the data is entered with the SPSS commands and subcommands. When this is the case, the DATA LIST specifications given here should suffice. In many instances in this manual illustrative data are given with the programs, in order to illustrate the data input. In the current version of SPSS it is assumed that the data are inline (present, in the same file with the other SPSS commands), unless otherwise specified in the DATA LIST statement.
Options for Listing Data
There are three options available for presenting data in SPSS, each associated with a keyword. The three keywords are LIST, FIXED, and FREE. FIXED is the default, so when it is used it does not have to be specified.
Proper Form for Listing Data in the LIST Format.
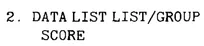
The program is informed of the manner of data presentation by the use of a keyword just preceding the slash in the DATA LIST command. For example,
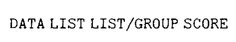
contains the word LIST in that position. The LIST data format has two implications. One, is that the information on each subject will appear in a separate entry (on a separate line or set of lines). Second, the information will appear within the entry in the order indicated after the slash, as in
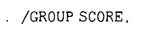
which tells the computer that the first number in each entry is called GROUP and the second number is called SCORE. This arrangement is followed for the data in Fig. 1.2.
Any single word with eight or less letters (and numbers) can be used to identify a component of the data, as long as the name begins with a letter. The first word following the slash is usually (although not necessarily) the name of the factor. It could usefully be given a name such as DOSAGE, ...
Table of contents
- Cover
- Title
- Copyright
- Dedication
- Contents
- Preface
- List of Programs
- CHAPTER 1. BASIC COMMANDS AND OMNIBUS F TESTS FOR COMPLETELY RANDOMIZED DESIGNS
- CHAPTER 2. BASIC COMMANDS AND OMNIBUS F TESTS FOR DESIGNS WITH REPEATED MEASURES
- CHAPTER 3. ANALYSIS OF COVARIANCE PROGRAMS
- CHAPTER 4. SIMPLE EFFECTS PROGRAMS
- CHAPTER 5. MULTIPLE COMPARISONS WITH A SINGLE BETWEEN SUBJECTS FACTOR
- CHAPTER 6. CONTRASTS WITH REPEATED MEASURES AND MULTIPLE FACTORS
- CHAPTER 7. TREND ANALYSIS
- INDEX
Frequently asked questions
Yes, you can cancel anytime from the Subscription tab in your account settings on the Perlego website. Your subscription will stay active until the end of your current billing period. Learn how to cancel your subscription
No, books cannot be downloaded as external files, such as PDFs, for use outside of Perlego. However, you can download books within the Perlego app for offline reading on mobile or tablet. Learn how to download books offline
Perlego offers two plans: Essential and Complete
- Essential is ideal for learners and professionals who enjoy exploring a wide range of subjects. Access the Essential Library with 800,000+ trusted titles and best-sellers across business, personal growth, and the humanities. Includes unlimited reading time and Standard Read Aloud voice.
- Complete: Perfect for advanced learners and researchers needing full, unrestricted access. Unlock 1.5M+ books across hundreds of subjects, including academic and specialized titles. The Complete Plan also includes advanced features like Premium Read Aloud and Research Assistant.
We are an online textbook subscription service, where you can get access to an entire online library for less than the price of a single book per month. With over 1.5 million books across 990+ topics, we’ve got you covered! Learn about our mission
Look out for the read-aloud symbol on your next book to see if you can listen to it. The read-aloud tool reads text aloud for you, highlighting the text as it is being read. You can pause it, speed it up and slow it down. Learn more about Read Aloud
Yes! You can use the Perlego app on both iOS and Android devices to read anytime, anywhere — even offline. Perfect for commutes or when you’re on the go.
Please note we cannot support devices running on iOS 13 and Android 7 or earlier. Learn more about using the app
Please note we cannot support devices running on iOS 13 and Android 7 or earlier. Learn more about using the app
Yes, you can access A Guide to SPSS for Analysis of Variance by Gustav Levine in PDF and/or ePUB format, as well as other popular books in Psychology & History & Theory in Psychology. We have over 1.5 million books available in our catalogue for you to explore.