![]()
Part I
Measuring Ecosystem
Services
![]()
1
Principles and Methods for Assessing Climate Change Mitigation as an Ecosystem Service in Agroecosystems
Kristell Hergoualc'h
Introduction
The concentration of carbon dioxide (CO2) and other greenhouse gases (GHGs) in the atmosphere has increased considerably over the last four decades. This increase primarily results from the burning of fossil fuels and the conversion of tropical forests to agriculture, with concomitant negative impacts upon the global climate. Agricultural activities account for about 13.5 per cent of total anthropogenic GHG emissions (Rogner et al, 2007) and release mainly nitrous oxide (N2O) and methane (CH4) (about 45 per cent of agricultural GHG emissions each), with CO2 accounting for the remaining share (Baumert et al, 2005). Agricultural N2O and CH4 emissions are expected to increase by 35 to 60 per cent in 2030 due to increased nitrogen fertilizer use, animal manure production and livestock numbers. In contrast, CO2 emissions are likely to remain at the same level due to stable or declining deforestation rates, and increased adoption of conservation tillage practices (Smith et al, 2007). Mitigating agricultural GHGs can be achieved by reducing emissions through more efficient management of carbon (C) and nitrogen (N) flows and by enhancing C storage in soil and vegetation (Smith et al, 2007). Agroforestry systems (AFS) are one means by which the impacts of climate change can be mitigated. The role that AFS play can be increased through payment for ecosystem services (PES) systems that reduce agricultural emissions and increase the quantity of carbon stored. Carbon sequestration (or atmospheric CO2 removal) as an ecosystem service of AFS is generally quantified as the amount of C stored in trees. Nevertheless, increasing tree density in agroforests may also modify soil fluxes of N2O or CH4, which have a global warming potential (GWP) 298 and 25 times higher than CO2, respectively (Forster et al, 2007). Nitrogen-fixing species used as shade trees (e.g. in coffee plantations) may increase soil emissions of N2O (Hergoualc'h et al, 2008) and reduce the soil CH4 sink (Palm et al, 2002).
This chapter reviews the biogeochemical processes controlling the fluxes of CO2, N2O and CH4 between agroecosystems and the atmosphere. It also presents the principles and methods for measuring these fluxes and assessing the net balance of GHGs in tropical agroecosystems.
Biogeochemical Processes Involved in GHG Exchanges between the Agroecosystem and the Atmosphere
Carbon dioxide (CO2)
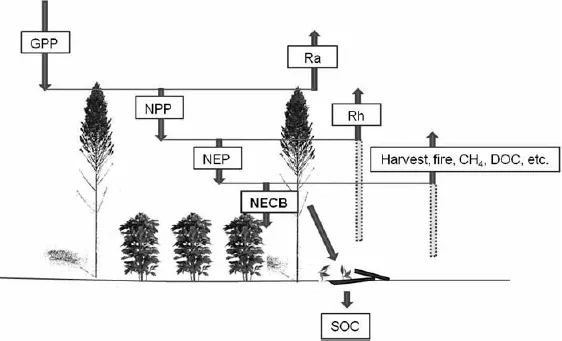
The amount of CO2 that is ‘fixed’ from the atmosphere by plants (i.e. oxidized into organic compounds during photosynthesis) is called gross primary production (GPP) (see Figure 1.1). About half of the GPP is incorporated within new plant tissues (foliage, wood and roots) and the other half is converted back to atmospheric CO2 by autotrophic respiration (Ra) (respiration by plant tissues) (IPCC, 2001). Annual plant growth is defined as net primary production (NPP) and relates to GPP and Ra as:
Each year part of the standing biomass is transferred to litter and soil layer carbon pools, where it is decomposed by soil microorganisms and fauna through heterotrophic respiration (Rh) (Ryan and Law, 2005). Heterotrophic respiration includes the decomposition of the recently deposited biomass, but also contains decomposition of organic matter that accumulated in the ecosystem during the past decades, centuries or millennia (Luyssaert et al, 2007). The rate of decomposition depends on the chemical composition of the dead tissues and on environmental conditions such as temperature and moisture (IPCC, 2001). The difference between NPP and Rh determines how much C is lost or gained by the ecosystem in the absence of disturbances that remove C from the ecosystem, such as harvesting or fire (IPCC, 2001). This C balance is the net ecosystem production (NEP):
Figure 1.1 The carbon cycle in agroecosystems
Notes: CH4 = methane; DOC = dissolved organic carbon; GPP = gross primary production; NECB = net ecosystem carbon balance; NEP = net ecosystem production; NPP = net primary production; Ra = autotrophic respiration; Rh = heterotrophic respiration; SOC = soil organic carbon.
Source: chapter author
The sum of Rh and Ra represents the total ecosystem respiration (Re) and the sum of the below-ground fraction of Ra and Rh is the soil respiration (Rs).
When other losses of carbon are accounted for, including fires, harvesting/removals (eventually combusted or decomposed), erosion and export of dissolved or suspended organic carbon (DOC) by rivers to the ocean and microbially produced CH4, what remains is the net biome production (NBP) (IPCC, 2001), also called net ecosystem carbon balance (NECB) (Luyssaert et al, 2007). By definition, for an ecosystem in steady state, Rh and other carbon losses would just balance NPP, and NECB would be zero (IPCC, 2001).
Nitrous oxide (N2O)
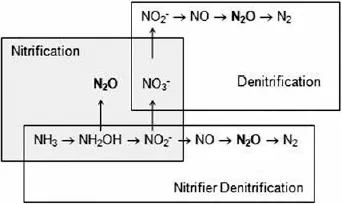
In the soil, nitrification and denitrification are the main processes that form N2O (Hergoualc'h et al, 2008). Nitrification is the aerobic oxidation of NH4+ or NH3 to NO2− and NO3−, with N2O production under either oxic or anoxic (nitrifier denitrification) conditions (Wrage et al, 2001). Denitrification is the anaerobic reduction of NO3− and NO2− to N2O and N2 (see Figure 1.2).
The main drivers of N2O emissions from soil are substrate supply, as N additions and mineralization of organic N in soil, soil water content and temperature (Skiba and Smith, 2000). Increased N supply to the soil through either N fertilization or N transfers from litter in systems with N2-fixing trees is known to substantially increase soil emissions of N2O (Rochette and Janzen, 2005; Stehfest and Bouwman, 2006). The effect of soil water content on soil N2O effluxes has been described as a monotonic curve with maximum emissions around field capacity, which is often around 60 per cent of water-filled pore space (WFPS) (Davidson, 1991). At higher water contents, N2O is primarily reduced to N2. Increased soil temperature generally causes exponential increases in N2O emissions (Smith et al, 2003).
Figure 1.2 Pathways for N2O production
Source: adapted from Wrage et al (2001)
Methane (CH4)
The microbial metabolism of CH4 is complex since soils can both produce and consume CH4, even simultaneously (Schimel and Holland, 2005). Methane production (Methanogenesis) is achieved by a group of anaerobic Archaea known as methanogens and occurs through either CO2 reduction:
or acetate fermentation:
Methane oxidation (Methanotrophy) is achieved by a group of aerobic bacteria called methanotrophs that use CH4 as their sole source of C and energy:
Several studies (Mosier et al, 1991; Knowles, 1993; Schnell and King, 1994) have demonstrated a link between methanotrophy and the nitrogen cycle. Because of the molecular similarity of CH4 and ammonia (NH3), autotrophic nitrifiers are able to oxidize CH4 and methanotrophs can oxidize NH3. Accordingly, CH4 oxidation can be inhibited by high soil ammonium concentrations, which occur after fertilization. On the other hand, in soil with a high cation exchange capacity, NH4+ resulting from fertilization would tend to be adsorbed on the argilo-humic complex of the soil rather than inhibiting methanotrophy (Mosier et al, 1991). Thus, while the overall increase in nitrogen fertilizer use will probably decrease global soil CH4 consumption, leading to greater atmospheric CH4 concentrations, the patterns are complex, with potential surprises in store (Schimel and Holland, 2005).
The total CH4 consumption rate is controlled by the potential biological demand and diffusion into the soil profile, notably by the WFPS (Mosier et al, 2004). Del Grosso et al (2000) observed that CH4 oxidation was optimal at WFPS of about 7.5 per cent for coarse-textured soils and 13 per cent for fine-textured soils.
Upland agricultural soils tend to consume CH4 rather than produce it; but the net flux (i.e. the balance of production and consumption) will vary depending on the soil, its properties and the vegetation. Vegetation is critical because it can affect the rate of CH4 production by supplying easily decomposable carbon through root exudates or recently dead roots (Schimel and Holland, 2005). Wetland soils (natural and paddies) emit CH4, although CH4 oxidizers can consume up to 90 per cent of the CH4 produced in the anaerobic zone before it reaches the atmosphere. Many wetland plants have air channels in their stems called aerenchyma that allow CH4 to diffuse upwards through the plant. In many wetland systems, 90 per cent or more of the CH4 that makes it out to the atmosphere is transported through the plants (Schimel and Holland, 2005).
Methods for Assessing the Net GHG Balance in Agroecosystems
Principles and methods for measuring the net ecosystem carbon balance (NECB)
There are two general methods for estimating the net C balance in an agro-ecosystem: the gain–loss approach and the stock-difference approach. The first method is a process-based approach that requires the annual rates of biomass (above and below ground) accumulation from growth and losses associated with harvest and burning, and the annual transfer into and out of dead organic matter and soil stocks. The second approach requires estimates of C stocks in biomass (above and below ground), dead organic matter (deadwood and litter) and soil (soil organic matter) at different points in time (IPCC, 2006). The first approach provides a net C flux without considering the C stock, whereas the net C flux obtained from the second approach integrates the stocks of the agroecosystem in at least two different points in time. The times when the fluxes or stocks are measured should be carefully chosen with respect to the expected growth of the agroecosystem. The evolution of C stocks in the agroecosystem can be assessed diachronically (measurement of the stocks at two points in time, at least, at one site) or synchronically (measurement of the stocks at the same time in at least two sites, which have the same initial state and have been identically cultivated but for a different period of time). For measurements achieved synchronically, also called chronosequences (IPCC, 2006), efforts are made to control between-site differences, such as soil type and topography. The evolution of fluxes in the agroecosystem may also be followed, diachronically or synchronically.
In a gain–loss approach, the NECB can be assessed from measurements of NEP and C loss from fires, harvests, soluble and physical removal, and CH4 flux. The NEP can be measured using meteorological techniques and calculated as the annual integral of the measured CO2 exchange between the agroecosystem and the atmosphere. Meteorological techniques estimate CO2 fluxes by measuring concentrations and concentration gradients. Tower-based micro-meteorological methods fall into two general categories: eddy correlation and concentration gradient techniques. Even though meteorological methods can yield integrated flux information for large areas and are useful for measuring seasonal variations, they require expensive and sophisticated instrumentation and are dependent on a uniform large surface and constant atmospheric conditions (Van Cleemput and Boeckx, 2006).
The stock-difference approach, covered in the following section, is more commonly used than the gain–loss approach for assessing the NECB.
Measurement of carbon stocks
In terrestrial ecosystems, there are four fundamental C pools:
1 above-ground biomass,
2 below-ground biomass,
3 necromass (or dead organic matter), and
4 soils (mineral and organic horizons),
although they may be further sub-divided depending on the ecosystem under investigation (Hamburg, 2000).
The IPCC (2006), for instance, subdivides the necromass pool into deadwood and litter in croplands. For each of these specific pools, there are several methods available for evaluating stocks. The most commonly used methods for measuring C stocks of these four pools are presented below.
Above-ground living biomass
All measurements of above-ground biomass in trees are dependent on the reliability of allometric relationships (Hamburg, 2000). Trees, like almost all organisms, have a highly deterministic form. Thus, by knowing one or two key attributes, many other attributes can be ...