- 204 pages
- English
- ePUB (mobile friendly)
- Available on iOS & Android
eBook - ePub
The Handbook of Carbon Accounting
About this book
Carbon Accounting is a vital tool in enabling organisations to measure and report on their greenhouse gas emissions. As the need to respond to the causes and impacts of climate change becomes increasingly urgent, emissions calculations and inventories are a vital first step towards mastering climatic risk. The Handbook of Carbon Accounting offers an accessible and comprehensive presentation of the discipline. The book examines the different methods or instruments implemented by countries and companies – such as carbon taxation, carbon markets and voluntary offsetting – while revealing how these stem not simply from the aim of reducing emissions for the lowest cost, but more as a compromise between divergent interests and individual world views. It also explores the historical context of the emergence of carbon accounting, assessing its evolution since the Rio Conference in 1992 and the signing of the Kyoto Protocol in 1997, to the latest Conference of Parties in 2015 in Paris.The book concludes with a very practical guide to calculate, reduce, offset and disclose your carbon footprint.Like other management tools, carbon accounting may not be an exact science, but its contribution has never been more important. The Handbook of Carbon Accounting is a vital educational resource that will help readers – including those with no prior knowledge of the field – to understand carbon flows and stocks and to take action. It forms part of a movement that heralds the start of a new economic era in which the search for prosperity can live in harmony with the environment.
Trusted by 375,005 students
Access to over 1.5 million titles for a fair monthly price.
Study more efficiently using our study tools.
Information
1
The birth of carbon accounting
Climate risk, the first signs of which can already be felt, truly hangs like a sword of Damocles over human development. Concentrations of GHGs have increased considerably since the Industrial Revolution, thanks largely to our methods of organization, production and consumption. In response to this challenge, the international community came together at the UN to build up a legal framework ultimately intended to "prevent dangerous anthropogenic interference with the climate system" (UNFCCC, 1992.).
The greenhouse effect: a natural phenomenon amplified by human activity
The greenhouse effect is a phenomenon that maintains the earth at an average temperature of around 15 degrees Celsius°, thus allowing life to exist. It is caused by the natural presence of greenhouse gases, which trap some of the heat emitted by sun in the atmosphere. Figure 1.1 provides a brief description of the natural phenomenon.
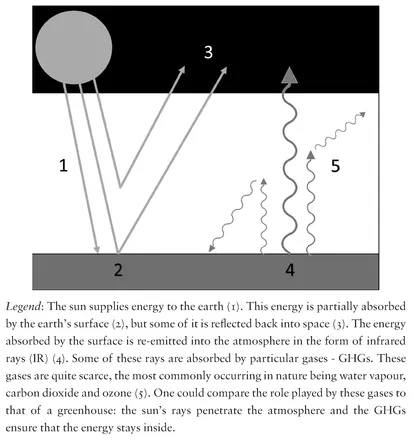
FIGURE 1.1 The greenhouse effect
The scientific term to describe the influence of GHGs on the earth's heat balance is "radiative forcing". This is defined as the difference between the radiative energy received and the radiative energy emitted by a given climatic system. Positive radiative forcing tends to heat up the system (more energy is received than emitted), while a negative radiative forcing leads to cooling (more energy is lost than received).
The main GHG is water vapour. However, direct emissions of water vapour have virtually no impact if we look only at the anthropogenic or additional greenhouse effect (which is in addition to the natural greenhouse effect). Indeed, this planet is essentially covered in water; furthermore, water remains in the atmosphere for only around one week and thus does not accumulate. This means that water-vapour emissions of human origin are not sufficient to interfere with the global water cycle.
CO2 is the main cause of the anthropogenic greenhouse effect. This colourless, odourless, chemical compound accumulates in the atmosphere for 125 years on average, which means that measures taken to limit emissions will not have an immediate effect on the CO2 concentration in the atmosphere. Methane (CH4) and nitrous oxide (N2O) are the two other main GHGs.
Changes in human activities, which contribute to the gas emissions mentioned above, have significantly impacted the concentration of GHGs in the atmosphere. This change was first identified some time ago. As early as 1896, the chemist Svante Arrhenius observed that the level of CO2 in the atmosphere had increased considerably since the start of the Industrial Revolution (Arrhenius, 1896). Understanding that this rise would continue with increased consumption of fossil fuels, and knowing the role of CO2 in determining global temperatures, this perceptive Swede concluded that if the concentration of this gas in the atmosphere doubled, the temperature would increase by several degrees.
The marked rise in our consumption of fossil fuels has inevitably been accompanied by constantly increasing emissions of GHGs into the atmosphere. Oil, natural gas and coal were formed by the slow decomposition of layers of vegetable residues, capturing atmospheric carbon over many millions of years. By burning these fuels we release an additional quantity of CO2 back into the atmosphere, interfering with the natural carbon cycle. Over several decades, we have released the quantity of CO2 that was emitted and captured by ecosystems over hundreds of millions of years.
Before humans appeared, the earth had already set up a process whereby the oceans, forests and soils "recycled" GHG emissions (principally CO2). However, the additional quantity released by human activities is so great that it is not all recycled by ecosystems. The IPCC (see Box 1.1) estimates that in 2000, of the 26 billion tonnes of CO2-equivalent (tCO2e) of annual emissions of human origin, around 15 GtCO2e are accumulated annually in the atmosphere and are not recycled (these emissions figures do not take into account deforestation). It is estimated that in 2012, global emissions had increased by 20% compared to 2000 (around 32 GtCO2e) and deforestation continued, limiting the recycling role of carbon sinks. As an increasing proportion of emissions is left unrecycled, the concentration of CO2 in the atmosphere increases. This number has risen from 280 parts per million (ppm) in the pre-industrial era to 403 ppm in 2016, a value that exceeds the interval of natural variation over the last 650,000 years. In 1990 this figure was just 353 ppm. Taking into account the full range of gases covered by the Kyoto Protocol, concentration of CO2-equivalent reached 478 ppm in 2014. However, if we also include aerosols, which cool the atmosphere, concentration is reduced to 441 ppm of CO2-equivalent, according to the European Environment Agency.
Box 1.1 The IPCC – scientific expertise to help political decision-makers
The Intergovernmental Panel on Climate Change (IPCC) was established in 1988 by the World Meteorological Organisation (WMO) and the United Nations Environment Programme (UNEP) at the behest of the G7. The role of the IPCC is to "assess the scientific, technical and socio-economic information relevant for understanding the risk of human induced climate change". This means it is not a research laboratory, but rather a body that assesses and brings together work carried out in research centres around the world.
All researchers working in an area related to the study of climate, including researchers whose work examines human influence on climate, can request that their work be studied as part of the assessment procedures organized by the IPCC. Thus far all official publications from the IPCC have been approved unanimously by the countries represented in the IPCC assembly.
In 1990 the IPCC published its first assessment report (FAR), which confirmed that climate change was a threat and called on the international community to act. The General Assembly of the United Nations responded in December 1990 by formally opening negotiations on the Framework Convention on Climate Change. The most recent assessment report (AR5) was produced in 2014 (IPCC, 2014). Almost 30 years after it was founded, the IPCC is still the most comprehensive source of information on climate change. In December 2007 its work received a Nobel Peace Prize, awarded jointly to former American vice president Al Gore.
Source: www.ipcc.ch.
In its fifth assessment report, the IPCC estimated that it was "extremely likely" (over 95% probability) that humans were responsible for the warming observed in the 20th century In addition, the IPCC found that it was "extremely likely" that continued anthropogenic emissions over the 21st century would lead to additional warming more significant than the warming that occurred in the 20th century.
An influential paper published in Nature (Meinshausen et al., 2009) shows that limiting the cumulative emissions of GHGs over the period 2000-2050 to 1,000 GtCO2e gives a 25% probability that warming will be over 2°C compared to the pre-industrial level (1.4°C compared to 1990). Given the total volume of emissions since 2000, we can consume only half of the economically recoverable reserves of oil, gas and coal if we are to meet this objective and limit the risk of warming being greater than 2°C. An OECD study estimates that if energy policy remains unchanged, the concentration of CO2-equivalent in the atmosphere could reach 685 ppm before the end of the century (OECD, 2012). This study inspired the Carbon Tracker Initiative, a non-profit organization that informs investors and market regulators about the risk of stranded assets (see glossary) resulting from the study of carbon budgets. Using all fossil fuels will breach the global carbon dioxide budget, and, in this new context, capital spent on finding and developing more reserves is largely wasted (Carbon Tracker, 2013).
Sustained growth of GHG emissions
Emissions have doubled since 1970
Global GHG emissions practically doubled between 1970 and 2010. The OECD estimates that these emissions could double again over the next 40 years if no measures are taken to reduce emissions, largely as a result of the particularly significant growth in the electricity sector (OECD, 2012).
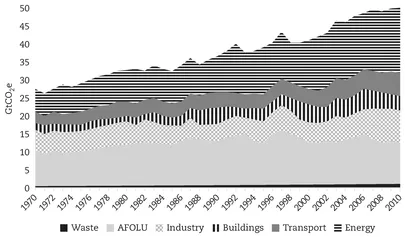
FIGURE 1.2 Changes in global greenhouse gas emissions (CO2-equivalent) emissions since 1970
Source: IPCC 2014 (WG3)
Source: IPCC 2014 (WG3)
China has been the largest emitter in the world since 2007, following spectacular growth in emissions. Emissions by the United States, the second largest emitter, have recently fallen, principally due to a transition from coal to gas in the electricity-generation sector. In the European Union (EU), emissions by the first 15 member states stabilized between 1990 and 2005, with a slight increase in CO2 emissions that was cancelled out by a reduction in emissions of CH4 and N2O. The reduction in emissions has been more marked since 2009, principally due to the slowdown in industrial production. The reduction is even more marked for the 27 member states, due to the brutal transition undergone by the countries of the former eastern bloc since the start of the 1990s. As a result of the increase in emissions by China between 2000 and 2011, emissions in China (7.2 tCO2e) and in the EU27 (7.5 tCO2e) were comparable by 2011 (see Figure 1.3).
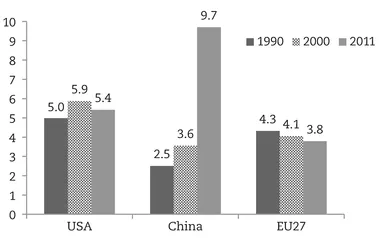
FIGURE 1.3 Changes in global emissions in the three main global economies (in tCO2/capita)
Source: European Commission, Joint Research Centre (JRC)/PBL Netherlands Environmental Assessment Agency. Emission Database for Global Atmospheric Research (EDGAR), release version 4.2
Source: European Commission, Joint Research Centre (JRC)/PBL Netherlands Environmental Assessment Agency. Emission Database for Global Atmospheric Research (EDGAR), release version 4.2
Various sources
Global anthropogenic emissions of GHGs can be divided into six broad categories (see Figure 1.2):
- Energy generation (electricity and heat) is responsible for one-third of emissions. Absolute emissions almost trebled to reach 17 GtCO2eq/year in 2010.
- Industry is responsible for nearly one-fifth of global GHG emissions. Its direct emissions (excluding waste, waste water and AFOLU contributions) grew from 5.4 GtCO2eq/year in 1970 to 8.8 GtCO2eq/year in 2010. The industrial-processes sector includes GHG emissions produced by various industrial activities not linked to energy, in which materials are processed chemically or physically. In industrial processes, such as cement production, metal and steel smelting in blast furnaces and the production of adipic acid, various GHGs can be emitted, such as CO2, CH4 and N2O).
- Building emissions grew from 2.5 GtCO2eq in 1970 to 3.2 GtCO2eq in 2010 with emissions-growth rates in OECD-1990 countries being largely negative.
- Transport emissions grew from 2.8 GtCO2eq in 1970 to 7 GtCO2eq in 2010.
- Emissions from agriculture, forestry and other land-use (AFOLU) are associated with livestock farming, manure and agricultural land as well as land-use changes. Emissions from livestock are caused by enteric fermentation (ruminants produce significant quantities of methane during their microbial digestion process). Land-use emissions covers emissions from man-made fires and controlled burning, as well as conversion of forests or prairies into agricultural land. AFOLU related emissions increased by 20% from 9.9 GtCO2eq in 1970 to 12 GtCO2eq in 2010, constituting about 20% to – 25% of all global emissions in 2010. This sector can be divided in two subsectors of approximately equal size: agriculture and land-use change (mostly deforestation, which is continuing at a sustained rate in developing countries).
- The waste sector includes emissions produced by treatment and disposal of waste. Sources of emissions include disposal of waste in the soil (dumps), waste-water treatment and incineration of waste. This sector emits barely 2.5% of total anthropogenic greenhouse gas emissions in 2010.
With the exception of deforestation, these broad categories apply to high-income regions such as Europe, Japan and North America. Deforestation does not pose a problem in these regions; there has been slight reforestation since 1990.
Low and lower middle-income countries contribute the largest share of emissions associated with AFOLU. Between 2000 and 2010, emissions by upper-middle-income countries from energy (+3.5 GtCO2e/year) and industry (+2.4 GtCO2e/year) more than doubled, and by 2010, emissions from industry in upper-middle-income countries have surpassed those from high-income countries (IPCC, 2014).
Transport and building account for a more significant proportion of emissions in Europe and North America (over one-third of GHG emissions) than globally (one-fifth).
While AFOLU emissions represent a small percentage in developed countries, almost 90% of GHG emissions from 1970-2010 in the least developed countries (LDCs) were generated by this sector alone.
Climate change affects many ecosystems
The climate change chat is currently underway, particularly temperature rises, have already influenced many physical systems and it has an impact on biodiversity and the way our societies are organized.
The IPCC estimates that sea levels will rise between 26 and 82 cm during the period from 1986-2005 to 2081-2100 (IPCQ 2014). This rise in sea levels will threaten coastal areas and will necessitate significant adaptation initiatives. The rise in water levels will be especially problematic for states with territories slightly above sea level, particularl...
Table of contents
- Cover
- Half Title
- Title
- Copyright
- Contents
- Figures and tables
- List of acronyms and abbreviations
- Introduction
- 1. The birth of carbon accounting
- 2. The basic principles of carbon accounting
- 3. Official inventories: the territory-based approach
- 4. Voluntary inventories: the "footprint" approach
- 5. Monetary inventories: what is the cost of a tonne of CO2?
- 6. Internalizing physico-chemical inventories in economic and political decisions
- Conclusion
- Annex: A Practical guide to calculate, reduce, offset and disclose your carbon footprint
- Glossary
- Bibliography
- About the author
Frequently asked questions
Yes, you can cancel anytime from the Subscription tab in your account settings on the Perlego website. Your subscription will stay active until the end of your current billing period. Learn how to cancel your subscription
No, books cannot be downloaded as external files, such as PDFs, for use outside of Perlego. However, you can download books within the Perlego app for offline reading on mobile or tablet. Learn how to download books offline
We are an online textbook subscription service, where you can get access to an entire online library for less than the price of a single book per month. With over 1.5 million books across 990+ topics, we’ve got you covered! Learn about our mission
Look out for the read-aloud symbol on your next book to see if you can listen to it. The read-aloud tool reads text aloud for you, highlighting the text as it is being read. You can pause it, speed it up and slow it down. Learn more about Read Aloud
Yes! You can use the Perlego app on both iOS and Android devices to read anytime, anywhere — even offline. Perfect for commutes or when you’re on the go.
Please note we cannot support devices running on iOS 13 and Android 7 or earlier. Learn more about using the app
Please note we cannot support devices running on iOS 13 and Android 7 or earlier. Learn more about using the app
Yes, you can access The Handbook of Carbon Accounting by Arnaud Brohé in PDF and/or ePUB format, as well as other popular books in Economics & Accounting. We have over 1.5 million books available in our catalogue for you to explore.