- 384 pages
- English
- ePUB (mobile friendly)
- Available on iOS & Android
eBook - ePub
About this book
Compact living is sustainable living. High-density cities can support closer amenities, encourage reduced trip lengths and the use of public transport and therefore reduce transport energy costs and carbon emissions. High-density planning also helps to control the spread of urban suburbs into open lands, improves efficiency in urban infrastructure and services, and results in environmental improvements that support higher quality of life in cities. Encouraging, even requiring, higher density urban development is a major policy and a central principle of growth management programmes used by planners around the world. However, such density creates design challenges and problems. A collection of experts in each of the related architectural and planning areas examines these environmental and social issues, and argues that high-density cities are a sustainable solution. It will be essential reading for anyone with an interest in sustainable urban development.
Trusted by 375,005 students
Access to over 1.5 million titles for a fair monthly price.
Study more efficiently using our study tools.
Information
Part I
An Understanding of High Density
1
Understanding Density and High Density
The word ‘density’, although familiar at first glance, is a complex concept upon closer examination. The complexity mainly stems from the multitude of definitions of the term in different disciplines and under different contexts. This chapter attempts to untangle the intricate concepts of density according to two perspectives – namely, physical density and perceived density. A thorough comprehension of these two distinct concepts of density will serve as a basis for understanding the meaning of high density. Hopefully, this chapter will establish the ground for the discussions in later chapters on the design of high-density cities with respect to the timeliest social and environmental issues.
Physical Density
Physical density is a numerical measure of the concentration of individuals or physical structures within a given geographical unit. It is an objective, quantitative and neutral spatial indicator. However, in practice, physical density takes on a real meaning only if it is related to a specified scale of reference.
For instance, density expressed as ratio of population to land area can vary significantly with reference to different scales of geographical unit. Take Hong Kong as an example: if the land area of the whole territory is taken into account, the overall population density in Hong Kong is about 6300 persons per square kilometre. However, only about 24 per cent of the total area in Hong Kong is built up. Therefore, if the geographical reference is confined to built-up land, then the population density will be about 25,900 individuals per square kilometre, which is four times the overall density of the territory. Hence, it is important that the scales of geographical references be explicitly defined in density calculation, otherwise comparison of density measures will be difficult.
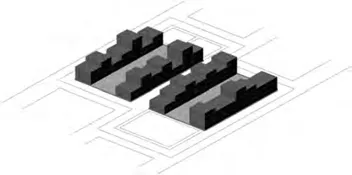
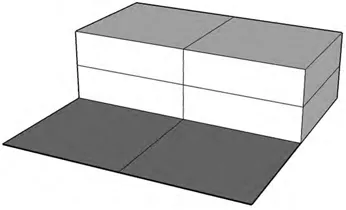
Nevertheless, there is no standard measure of density; there are only measures that are more widely used than others. In town planning, measurement of physical density can be broadly divided into two categories: people density and building density. People density is expressed as the number of people or household per given area, while building density is defined as the ratio of building structures to an area unit. Common measures of people and building densities are outlined as follows.
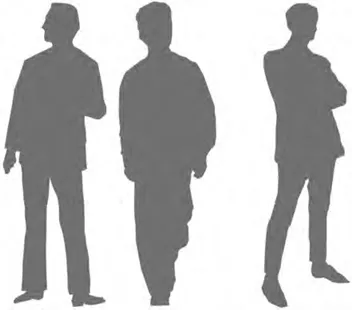
Source: Vicky Cheng
Figure 1.1 People density

Source: Vicky Cheng
Figure 1.2 Building density
Measures of People Density
Regional Density
Regional density is the ratio of a population to the land area of a region. The reference area is usually defined by a municipal boundary and includes both developed and undeveloped land. Regional density is often used as an indicator of population distribution in national planning policy.
Residential Density
Residential density is the ratio of a population to residential land area. This measure can be further classified in terms of net and gross residential densities based on the definition of the reference area. However, there is no consensus on the definition of net and gross areas; it varies across cities and countries. In the UK, net residential area refers only to land covered by residential development, along with gardens and other spaces that are physically included in it; this usually also takes into account half the width of adjacent roads (TCPA, 2003). In Hong Kong and some states in the US, net residential area only consists of the parcels allocated for residence where internal road, parks and other public lands are excluded (Churchman, 1999; Hong Kong Planning Department, 2003).
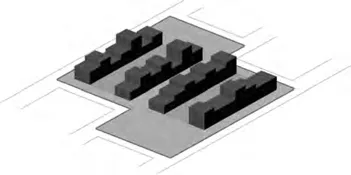
Source: Illustration redrawn by Vicky Cheng, adapted from Greater London Authority (2003, p11)
Figure 1.3 Net residential area
Source: Illustration redrawn by Vicky Cheng, adapted from Greater London Authority (2003, p11)
Figure 1.4 Gross residential area
The measure of gross residential density considers the residential area in its integrity. In addition to the area allocated for residence, it also takes into account non-residential spaces such as internal roads, parks, schools, community centres and so on which are meant to serve the local community. Nevertheless, in practice, it is difficult to clearly define the extent of these residentially related areas. Some developments may take into account lands for purposes of serving a wider neighbourhood and others may include non-developable land such as steep slopes. This inconsistency of inclusion leads to great ambiguity in gross density measurement and, in turn, makes comparison difficult.
Occupancy Density
Occupancy density refers to the ratio of the number of occupants to the floor area of an individual habitable unit. The reference habitable unit can be any kind of private or public space, such as a dwelling, office, theatre and so on. However, the reference area usually refers only to an enclosed area. Occupancy density is an important measure in building services design as it provides an indicator for estimating the services required. For instance, the electricity demand, space cooling and heating load, provision of fire safety facilities, and so forth are estimated based on the occupancy density.
Occupancy rate, which is the inverse measure of occupancy density (i.e. ratio of floor area of individual unit to number of occupants), is commonly used as an indicator of space available for individual occupants. Higher occupancy rate means larger habitable area for individual occupants. Regulation of minimum occupancy rate is often used in building design to safeguard the health and sanitary condition of habitable spaces.
Measures of Building Density
Plot Ratio (Floor Area Ratio)
Plot ratio is the ratio of total gross floor area of a development to its site area. The gross floor area usually takes into account the entire area within the perimeter of the exterior walls of the building, which includes the thickness of internal and external walls, stairs, service ducts, lift shafts, all circulation spaces, and so on.
Site area refers to the total lot area of the development, which, in most cases, is precisely defined in the planning document. Since the definitions of both floor and site areas are relatively clear in the measurement, plot ratio is considered as one of the most unambiguous density measures.
In planning practice, plot ratio is extensively adopted as a standard indicator for the regulation of land-use zoning and development control. Different plot ratios for different types of land uses are often specified in urban master plans as a provision of mixed land use. Furthermore, maximum plot ratio is often controlled in the master plan in order to govern the extent of build-up and to prevent overdevelopment.
In building design, plot ratio is widely used in design briefing and development budgeting as it reflects the amount of floor area to be built and, hence, can be used to estimate the quantity of resources required for construction; consequently, it can forecast the financial balance of investment and returns.
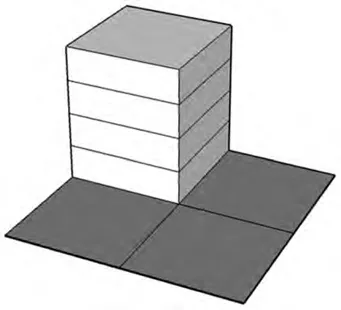
Source: Vicky Cheng
Figure 1.5 Plot ratio = 1
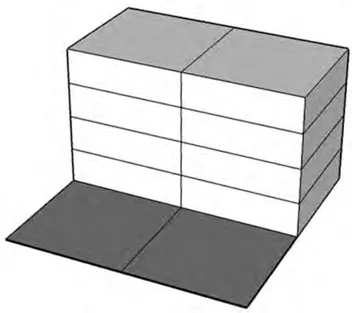
Source: Vicky Cheng
Figure 1.6 Plot ratio = 1.5
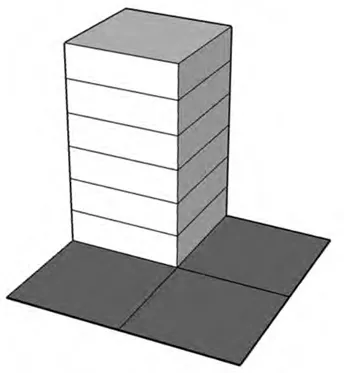
Source: Vicky Cheng
Figure 1.7 Plot ratio = 2
Site Coverage
Site coverage represents the ratio of the building footprint area to its site area. Therefore, site coverage is a measure of the proportion of the site area covered by the building. Similar to plot ratio, site coverage of individual developments is often controlled in urban master planning in order to prevent over-build and to preserve areas for greenery and landscaping.
The open space ratio, which is the inverse measure of site coverage, indicates the amount of open space available on the development site. However, the term is sometimes also expressed as area of open space per person and this measure is used by the planning authority to safeguard a reasonable provision of outdoor space for the population.
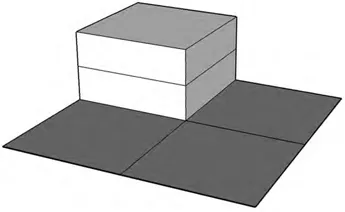
Source: Vicky Cheng
Figure 1.8 Site coverage = 25 per cent
Source: Vicky Cheng
Figure 1.9 Site coverage = 50 per cent
Apart from plot ratio and site coverage, other density measures, such as regional and residential densities, can also be expressed in terms of building density. Measurement of residential density with respect to number of dwellings per land area is an important indicator in the making of planning policy. In the UK, for instance, the government has set a residential density of 30 dwellings per hectare as the national indicative minimum for new housing development (UK Office of the Deputy Prime Minister, 2006).
Density Gradient and Density Profile
The density measures discussed so far are based on averages over a land area. These measures can properly reflect reality if people or buildings are fairly evenly distributed over the entire area. However, in many cases, especially when the reference geographical unit is large in scale, the distribution pattern of people or buildings can vary significantly.
Take Hong Kong as an example: the average population density over the entire territory is about 6300 persons per square kilometre. Nevertheless, the distribution of the population is very uneven across districts, ranging from 780 people per square kilometre in the outlying islands to 52,000 people per square kilometre in the urban area (Hong Kong Census and Statistics Department, 2006).
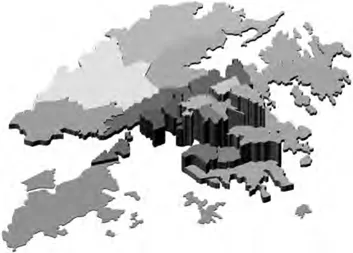
Source: Vicky Cheng
Figure 1.10 Hong Kong population density map (magnitude represented in height): high density in the central urban area and low density in outlying islands
In order to address the spatial variation of density, other means of density measurements, such as density gradient and density profiles, have been introduced.
Density Gradient
Density gradient is defined as the rate at which density falls (according to distance) from the location of reference; therefore, a positive density gradient denotes a decline of density away from the reference location. The density gradient is usually derived from densities measured in a series of concentric rings at a 10m or 20m width, radiating out from the location of the reference (Longley and Mesev, 2002).
Density gradient is a composite measure of density. Comparing the changing pattern of density gradients over time can review the process of spatial evolution. Figure 1.12 shows two changing patterns of density gradient. Figure 1.12 (a) represents a process of progressive decentralization with decreasing population density in the urban centre and increasing density and boarders towards the outskirts. In contrast, Figure 1.12 (b) depicts a process of centralization with growing population density in both the urban centre and outskirts and, at the same time, enlarging borders towards the periphery. Between 1800 and 1945, the North American metropolis exhibited the former process of decentralization, while European counterparts resembled the latter process of centralization (Muller, 2004).
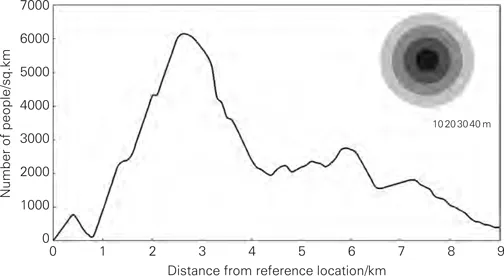
Source: Illustration redrawn by Vicky Cheng and adapted from Longley and Mesev (2002, p20)
Figure 1.11 Population density gradient from the town centre towards rural outskirts
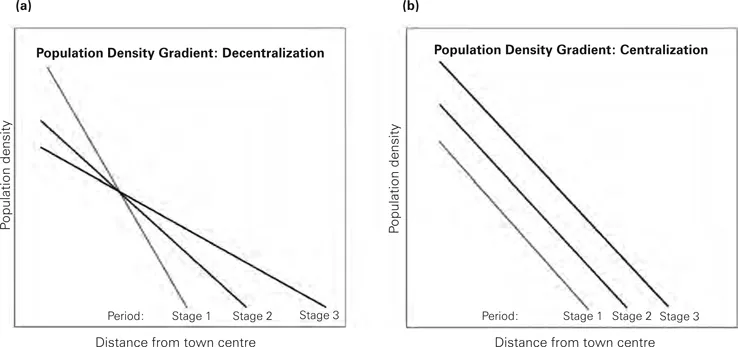
Source: Illustration redrawn by Vicky Cheng and adapted from Muller (2004, p62)
Figure 1.12 Density gradients over time: progress from stage 1 to stage 3 – (a) progressive decentralization with decreasing population density in the urban centre and increasing density towards the outskirts; (b) centralization with growing population density in the urban centre and outskirts, as well as enlarging borders towards the periphery
Density Profile
Density profile refers to a series of density measurements based on a reference location but calculated in different spatial scales. Similar to density gradient, it is a measure of the rate at which density changes away from the reference location and is used as an indicator of settlement structure.
Density profile has been adopted in the UK as the basis for rural definition. In the UK rural classification system, density profile is calculated based on land area enclosed by a series of concentric circles of 200m, 400m, 800m and 1600m radii. The variation of density at these successive scales is then used to characterize the spatial structure of different settlements. For example, a village as defined in the classification system has the following properties:
- a density of greater than 0.18 residences per hectare at the 800m scale;
- a density at least double of that at the 400m scale; and
- a density at the 200m scale at least 1.5 times the density at the 400m scale (Bibby and Shepherd, 2004).
Through comparing the measured density profile with the predefined profiles, settlements of different spatial structures can be classified.
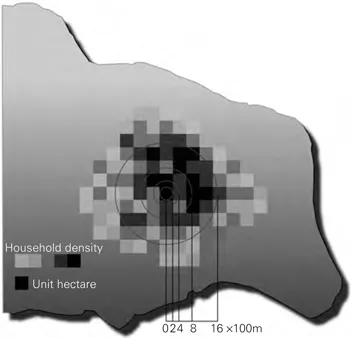
Source: Vicky Cheng
Figure 1.13 Density prof...
Table of contents
- Cover Page
- Half Title page
- Title Page
- Copyright Page
- Contents
- List of Figures and Tables
- List of Contributors
- Foreword
- Preface
- Acknowledgements
- List of Acronyms and Abbreviations
- Part I An Understanding of High Density
- Part II Climate and High-Density Design
- Part III Environmental Aspects of High-Density Design
- Part IV High-Density Spaces and Living
- Index
Frequently asked questions
Yes, you can cancel anytime from the Subscription tab in your account settings on the Perlego website. Your subscription will stay active until the end of your current billing period. Learn how to cancel your subscription
No, books cannot be downloaded as external files, such as PDFs, for use outside of Perlego. However, you can download books within the Perlego app for offline reading on mobile or tablet. Learn how to download books offline
Perlego offers two plans: Essential and Complete
- Essential is ideal for learners and professionals who enjoy exploring a wide range of subjects. Access the Essential Library with 800,000+ trusted titles and best-sellers across business, personal growth, and the humanities. Includes unlimited reading time and Standard Read Aloud voice.
- Complete: Perfect for advanced learners and researchers needing full, unrestricted access. Unlock 1.5M+ books across hundreds of subjects, including academic and specialized titles. The Complete Plan also includes advanced features like Premium Read Aloud and Research Assistant.
We are an online textbook subscription service, where you can get access to an entire online library for less than the price of a single book per month. With over 1.5 million books across 990+ topics, we’ve got you covered! Learn about our mission
Look out for the read-aloud symbol on your next book to see if you can listen to it. The read-aloud tool reads text aloud for you, highlighting the text as it is being read. You can pause it, speed it up and slow it down. Learn more about Read Aloud
Yes! You can use the Perlego app on both iOS and Android devices to read anytime, anywhere — even offline. Perfect for commutes or when you’re on the go.
Please note we cannot support devices running on iOS 13 and Android 7 or earlier. Learn more about using the app
Please note we cannot support devices running on iOS 13 and Android 7 or earlier. Learn more about using the app
Yes, you can access Designing High-Density Cities by Edward Ng in PDF and/or ePUB format, as well as other popular books in Politics & International Relations & Urban Planning & Landscaping. We have over 1.5 million books available in our catalogue for you to explore.