- 264 pages
- English
- ePUB (mobile friendly)
- Available on iOS & Android
eBook - ePub
Climate and Global Environmental Change
About this book
Climatic change, now more than ever in this age of global warming, is seen as fundamental to the study of the environment. This text examines the importance of climate as one of the major forcing functions in the global environmental change process. It emphasizes both human-induced climatic change and natural climatic change, providing a comprehensive historical context and important projections for the future. It offers a thorough, up-to-date, critical overview of the physical science behind global warming concerns.
Trusted by 375,005 students
Access to over 1.5 million titles for a fair monthly price.
Study more efficiently using our study tools.
Information
Part 1
Introduction
Chapter 1
Climatic change and variability – past, present and future
Evidence from the geological record indicates that the Earth’s climate has changed throughout the Earth’s geological history, spanning more than 3 billion years. Geological evidence can also be used to reconstruct past variations in the concentration of CO2 (carbon dioxide) and CH4 (methane), which are two important heat-trapping gases. The ice preserved in the Antarctic and Greenland ice caps contains air bubbles that were sealed off within a few hundred years of the accumulation of the snow, thereby providing samples of the atmosphere for the last 250,000 years. From these air bubbles we can measure changes in the concentrations of CO2 and CH4. Other, less certain evidence has been used to reconstruct the variation in the atmospheric CO2 concentration as far back as 570 million years (e.g. Berner, 1994). Past variations in the Earth’s climate and in the composition of the atmosphere provide a long-term perspective against which the human-induced changes in the atmosphere, and projected changes in the atmosphere and in climate, can be compared. In this chapter this long-term perspective is presented.
1.1 A geological perspective
Figure 1.1 shows the reconstructed variation in the average surface air temperature of the Earth, with each successive panel showing greater detail for time spans progressively closer to the present. Figure 1.1(a) gives a generalized temperature and precipitation history of the Earth during the past 3 billion years based on a variety of paleoclimatic indicators, some of them qualitative in nature. Figure 1.1(b) shows the variation in the oxygen isotope composition of bottom-dwelling foraminifera in the global ocean during the past 70 million years, along with a rough quantitative temperature scale. The deep waters of the worlds oceans decreased from about 12°C around 60 million years ago, to near 0°C at present. Figure 1.1(c) shows the variation in the oxygen isotope composition of bottom-dwelling foraminifera at Ocean Drilling Project site 677 during the past 1.2 million years; fluctuations at this time scale are largely the result of variations in the global volume of ice on land. Figure 1.1(d) shows the variation in the oxygen isotope composition of ice that accumulated on Devon Island, in the Canadian Arctic Archipelago, during the last 120,000 years. These fluctuations are related to changes in the temperature of the air masses over the ice, and a rough temperature scale is provided based on the correlation between the oxygen isotope composition of Arctic precipitation and temperature given in Johnsen et al. (1989). Finally, Figure 1.1(e) shows the variation in the isotope ratio in Devon Island ice during the past 1000 years. From these data it can be seen that the Earth’s climate changes at a wide range of time scales, with decadal-scale variations superimposed on century and millennial time-scale variations, which in turn are superimposed on variations spanning tens of thousands of years, which are superimposed on still longer time-scale variations, and so on. Major episodes of glaciation, interspersed with interglacial intervals, occurred during the pre-Cambrian period, during the Permo-Carboniferous period, and during the past 3 million years. In between these glacial–interglacial episodes have been extended periods with climates substantially warmer than during the present interglacial period. In short, the climate is a dynamic, constantly changing phenomenon.
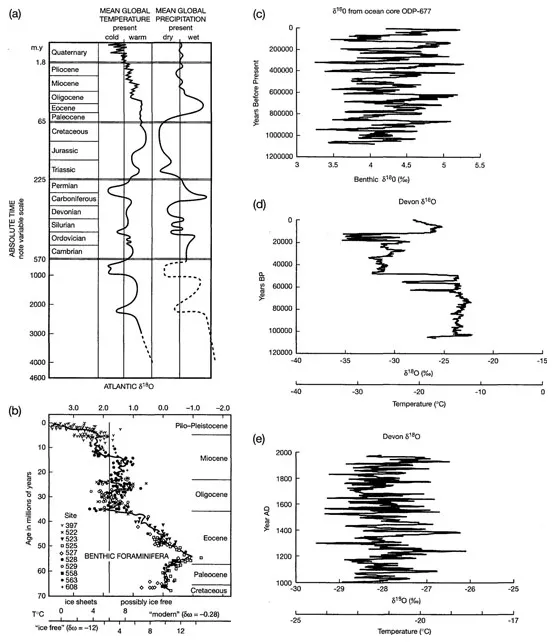
Figure 1.1 (a) Reconstructed variation in global mean surface air temperature and precipitation during the past 3.0 billion years, from Frakes (1979). (b) Variation in the oxygen isotopic composition of deep-sea foraminifera in the global ocean during the past 70 million years, and an approximate interpretation in terms of the temperature of deep ocean water, from Miller et al. (1987). (c) Oxygen isotope variation of deep ocean sediments at ODP site 677 during the past 1.2 million years, (d, e) Variation in the oxygen isotope composition of ice on Devon Island during (d) the past 120,000 years, and (e) the past 1000 years, along with a very rough scale for temperature fluctuations. Data for (c) were obtained from the paleoclimatic data web site: ftp://ftp.ngdc.noaa.gov/paleo/paleocean/sedimentfiles/complete/odp-677.csv, while data for (d) and (e) were obtained from ftp://ftp.ngdc.noaa.gov/paleo/polar/devon/devondata/d72del.200, and ftp://ftp.ngdc.noaa.gov/paleo/polar/devon/devondata/d7273del.5yr, respectively.
Figure 1.2 shows the variation in atmospheric CO2 concentration over the last 570 million years as inferred from computer models that simulate the geological time-scale flows of carbon. There is no direct record of atmospheric CO2 concentration this far back, but measurements of quantities that would have been affected by changes in the carbon cycle, such as the chemical composition of oceanic sediments, can be used as a rough check on these models. According to the results shown in Figure 1.2, the atmospheric CO2 concentration has varied significantly over periods of tens to hundreds of millions of years, reaching concentrations of 4–16 times the pre-industrial concentration of 280 ppmv (parts per million by volume), albeit with a large uncertainty range. Figure 1.3 shows the variation in atmospheric CO2 and CH4 concentration over the past 160,000 years as directly measured in air bubbles trapped in Antarctic ice. Also shown on Figure 1.3 are the present concentrations of CO2 and CH4, and a continuation of the upward trend during the next few centuries as a result of human emissions. During the last 160,000 years, CO2 underwent natural variations in concentration from as low as 180 ppmv to as high as 300 ppmv, while CH4 varied between 0.3 and 0.7 ppmv. In contrast, human activities during the past 200 years have increased the CO2 concentration to over 360 ppmv and the CH4 concentration to over 1.7 ppmv. Furthermore, the rates of change during the last 200 years far exceed the rates of change that occurred naturally during the preceding 160,000 years.
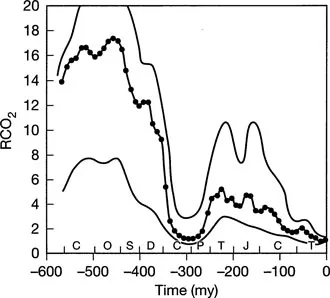
Figure 1.2 Reconstructed variation in atmospheric CO2 concentration during the past 570 million years. Reproduced from Berner (1994).
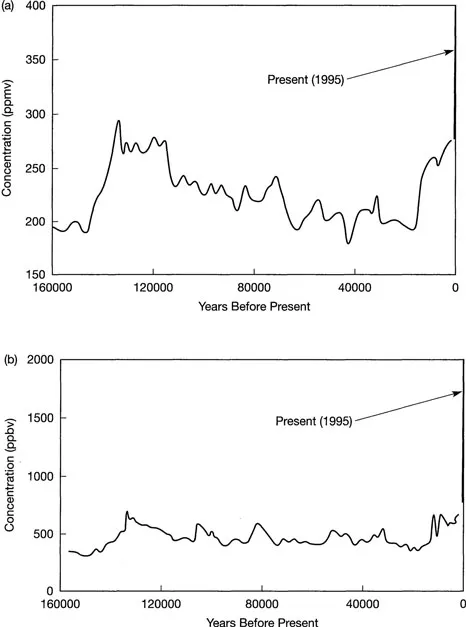
Figure 1.3 Variation in atmospheric (a) CO2 and (b) CH4 concentration during the past 160,000 years, as measured in air bubbles trapped in Antarctic ice. Based on data in Barnola et al. (1991), for CO2, and Chapellaz et al. (1990), for CH4. Both datasets were obtained from the National Oceanographic and Atmospheric Administration (NOAA) website, http://www.ngdc.noaa.gov/paleo.
1.2 Future prospects and the scientific basis of concern
Not only are the recent, human-induced changes in the atmospheric concentration of CO2 and CH4 unprecedented in speed and magnitude, but “business-as-usual” (BAU) projections (i.e., assuming no effort to restrain emissions) indicate that far larger changes will occur during the 21st century and beyond. Figure 1.4 shows a closeup of the BAU projections of atmospheric CO2 and CH4 concentration that were shown as a sharp spike at the right-hand edge of Figure 1.3. The emissions assumed for this projection are discussed in Chapter 4 but are not at all excessive. As seen from this figure, the atmospheric CO2 concentration could reach six times the pre-industrial concentration, while CH4 could reach four times the pre-industrial concentration. Significant increases in the concentrations of other GHGs are also projected. On the basis of verifiable laboratory measurements, these concentration increases will lead to a significant trapping of heat, and on the basis of very fundamental physical principles and observational evidence, this heat trapping will almost certainly lead to changes in climate that are significant from a human and ecological point of view. Also shown in F...
Table of contents
- Cover Page
- Half Title page
- Title Page
- Copyright Page
- Contents
- Series Preface
- Acknowledgements
- Part I Introduction
- Part II Climatic change From emissions to climate system response
- Part III The science–policy interface
- Glossary
- References
- Web Sites Used
- Index
Frequently asked questions
Yes, you can cancel anytime from the Subscription tab in your account settings on the Perlego website. Your subscription will stay active until the end of your current billing period. Learn how to cancel your subscription
No, books cannot be downloaded as external files, such as PDFs, for use outside of Perlego. However, you can download books within the Perlego app for offline reading on mobile or tablet. Learn how to download books offline
Perlego offers two plans: Essential and Complete
- Essential is ideal for learners and professionals who enjoy exploring a wide range of subjects. Access the Essential Library with 800,000+ trusted titles and best-sellers across business, personal growth, and the humanities. Includes unlimited reading time and Standard Read Aloud voice.
- Complete: Perfect for advanced learners and researchers needing full, unrestricted access. Unlock 1.5M+ books across hundreds of subjects, including academic and specialized titles. The Complete Plan also includes advanced features like Premium Read Aloud and Research Assistant.
We are an online textbook subscription service, where you can get access to an entire online library for less than the price of a single book per month. With over 1.5 million books across 990+ topics, we’ve got you covered! Learn about our mission
Look out for the read-aloud symbol on your next book to see if you can listen to it. The read-aloud tool reads text aloud for you, highlighting the text as it is being read. You can pause it, speed it up and slow it down. Learn more about Read Aloud
Yes! You can use the Perlego app on both iOS and Android devices to read anytime, anywhere — even offline. Perfect for commutes or when you’re on the go.
Please note we cannot support devices running on iOS 13 and Android 7 or earlier. Learn more about using the app
Please note we cannot support devices running on iOS 13 and Android 7 or earlier. Learn more about using the app
Yes, you can access Climate and Global Environmental Change by L. D. Danny Harvey in PDF and/or ePUB format, as well as other popular books in Biological Sciences & Environmental Science. We have over 1.5 million books available in our catalogue for you to explore.