This book focuses on the practical issues and approaches to handling longitudinal and multilevel data. All data sets and the corresponding command files are available via the Web. The working examples are available in the four major SEM packages--LISREL, EQS, MX, and AMOS--and two Multi-level packages--HLM and MLn. All equations and figural conventions are standardized across each contribution. The material is accessible to practicing researchers and students. Users can compare and contrast various analytic approaches to longitudinal and multiple-group data including SEM, Multi-level, LTA, and standard GLM techniques. Ideal for graduate students and practicing researchers in social and behavioral sciences.

eBook - ePub
Modeling Longitudinal and Multilevel Data
Practical Issues, Applied Approaches, and Specific Examples
- 304 pages
- English
- ePUB (mobile friendly)
- Available on iOS & Android
eBook - ePub
Modeling Longitudinal and Multilevel Data
Practical Issues, Applied Approaches, and Specific Examples
About this book
Trusted by 375,005 students
Access to over 1.5 million titles for a fair monthly price.
Study more efficiently using our study tools.
Information
CHAPTER ONE
Modeling Longitudinal and Multilevel Data
Kai Uwe Schnabel
Max Planck Institute for Human Development, Berlin
Todd D.Little
Yale University
Jürgen Baumert
Max Planck Institute for Human Development, Berlin
Both longitudinal and multilevel designs can provide invaluable empirical evidence for many, if not most, of the central assertions made by theories in the social and behavioral sciences (Baltes & Nesselroade, 1979; Menard, 1991). However, because such designs often involve considerable investments of time and money, their use is only justifiable if the resulting data can be analyzed adequately and thereby represented clearly. More often than not, however, disillusionment is part of the researchers’ experience after the longitudinal or multilevel data are collected. For example, the puzzling number of different ways to analyze longitudinal data is likely to frustrate many researchers who neither consider themselves experts in statistics nor intend to become one. And multilevel designs also offer a plethora of complexities when it comes to decomposing the various sources of variability in the participants’ responses.
Although researchers in the behavioral and social sciences are quite sophisticated when it comes to methodological and statistical issues, keeping up with the rapid advances and understanding the inherent complexities in the various analytic techniques for addressing longitudinal and multilevel data can be daunting. Such frustrations are made even more salient because more and more research questions lead researchers to use increasingly sophisticated longitudinal or multilevel designs. This volume is targeted to those researchers who wish to understand the practical issues and to learn from actual applications to address such data.
Many practical and theoretical issues are involved when addressing longitudinal and multilevel data. Some of these issues include (a) what information should be evaluated, (b) what decision heuristics should be used, and (c) what procedures are most appropriate. In addressing these issues, a primary goal of each contribution is to highlight a specific set of issues and to demonstrate clear procedures for addressing those issues. Each contribution shares the theme that making strong tests of underlying theoretical models (i.e., bringing implicit assumptions into the explicit realm of model specification) is critical for drawing veridical conclusions from one’s data. They also share the common theme that statistical procedures are not mechanistic ends in themselves (i.e., fixed and rule-bound), but rather are flexible tools that should be adjusted and adapted into an appropriate means for testing a given substantive theory.
Why Address Longitudinal and Multilevel Analysis Problems Simultaneously?
At first sight, our decision to integrate longitudinal and multilevel data analysis in this volume may seem surprising. However, when one goes beyond a “cookbook understanding” of statistical procedures and examines the basic rationale behind longitudinal and multilevel procedures, many linkages between both perspectives become clear. Hox (chap. 2, this volume), for instance, demonstrates a number of uses of the multiple-group option in structural equation programs to model hierarchically structured data. Similarly, MacCallum and Kim (chap. 4, this volume) show how both analytic perspectives can be integrated to investigate correlates of change. Little, Linden-berger, and Maier (chap. 10, this volume) also describe ways to integrate multilevel and longitudinal analyses to examine selectivity effects in longitudinal data.
Another reason for using multilevel comparisons in the context of longitudinal analysis is implicitly addressed in several chapters of this volume and is related to the common vagaries of most theories in the social sciences when it comes to precisely predicting change processes over time. It is common that a researcher is not able to derive an exact a priori hypothesis about the shape of the developmental function describing the nature of the changes over time. In this case, rules of parsimony then become an auxiliary guideline to help choose a developmental function that is mathematically feasible and is a reasonable approximation of the data (e.g., using simple models such as linear-growth functions, or polynomial functions of limited degrees such as quadratic and cubic trends; Schnabel, 1996). Although investigating interindividual differences in development is a fundamental issue in longitudinal research (Baltes & Nesselroade, 1979), many research questions that come up in this context often have an exploratory character to them. McArdle and Bell (chap. 5, this volume) offer clear recommendations when an analysis is more exploratory in nature, that is, to utilize a highly parameterized (i.e., saturated) time-to-time-change model (e.g., spline models; Meredith & Tisak, 1990), which does not fit a particular curve function across the sequence of measurements, in order to describe the degree of deviation between this solution and a less parameterized, more parsimonious, model. The crux of the problem with weakly justified decisions about the underlying change model is that they can have a strong influence on the estimation of the central parameters. Checking the stability of the results across relevant subgroups is another heuristic to test the robustness of the model.
The merits of pragmatism is one lesson to learn across the chapters of this volume, including the realm of inferential statistics. For example, from the perspective of the general linear model, Widaman (chap. 9, this volume) emphasizes the idea of testing a hierarchically ordered sequence of alternative models that differ according to theoretically meaningful constraints (e.g., across time and/or groups) rather than relying on traditional hypothesis testing procedures when one is testing complex models. Such a shift in the empirical rationale is a well-known feature of structural equation modeling, but it is less common to traditional inferential approaches. Clearly, classical inferential statistics (e.g., ANOVA) have little or no ambiguity in the model when they are applied to fully experimental data (i.e., the adequacy of the implicit model underlying the data analysis is determined by the degree it correctly reflects the experimental design, with the only uncertainty being the assumptions about the distribution of the variable or variables in the population). However, as soon as one collects data using a nonexperimental design, the underlying statistical model needs to be used adaptively in order to test the assumptions about the processes generating the data. In other words, the shift from strict hypothesis testing to the logic of model testing is not made because one uses structural equation modeling procedures, but rather because one uses quasi-experimental data (Cook & Campbell, 1979).
Ambiguity in Longitudinal Research: Testing and Modeling
Analyzing longitudinal data sometimes renders the researcher with the uncomfortable feeling of ambiguity and relativity of the findings. However, such ambiguity can also be seen as a chance to investigate alternative uses of statistical analysis procedures; namely, to apply them in a creative (theory-driven) way. As mentioned, statistical procedures are only analytic tools that one uses to try to model the underlying dynamic of a set of variables—in this sense, there is no single best way for analyzing a given data set.
The long-standing debate about the epistemological value of structural equation models and the related debate about whether it is permissible to make causal inferences from cross-sectional data is not automatically solved by using longitudinal data. The problem may even be acerbated in a multiwave study when, for instance, the variance of a variable (or a latent construct) decreases over time, indicating a negative correlation between intercept and slope that is not easy to detect with fallible measures (Raykov, 1994b; Rogosa, Brandt, & Zimowski, 1982). Coleman (1968), for example, provided theoretical arguments why this is likely for many psychological variables that are embedded in a complex homeostatic system where the organism actively works to reduce extreme system states in order to regain equilibrium. It can easily be shown that any existing causal influence on the dependent variable from an independent variable measured on a prior occasion (cross-lagged coefficient) can only add variance to the dependent variable—irrespective of its sign. Thus, a shrinkage in vari-ance does not indicate that other relevant explanatory variables were missing. This casts a slightly different light on the dichotomy of stability and change and the widely held belief that change needs to be explained because it is an active process whereas stability is considered the trivial nonactive behavior of the system. At least in the realm of psychological and educational research, understanding the processes related to stability should be given the same theoretical and empirical importance as understanding the processes related to change (Nesselroade, 1991).
Structural Equation Modeling and Hierarchical Linear Models—The Unequal Twins
The present volume focuses considerably on structural equation modeling (SEM) and hierarchical linear modeling (HLM) procedures to analyze longitudinal data. This emphasis is due primarily to the fact that both approaches are flexible tools for examining complicated data structures in a feasible way. In several chapters, the contributors show that both approaches yield exactly or approximately the same results. For example, Hox (chap. 2, this volume) shows that SEM can be used for nested data. Chou, Bentler, and Pentz (chap. 3, this volume) demonstrate their similarity in the context of latent growth modeling, showing that a less complex—although less efficient—two-step approach produces approximately the same point estimates. As MacCallum and Kim (chap. 4, this volume) demonstrate, it is possible to analyze simultaneously more than one dependent variable in the HLM framework, thus enabling the researcher, when the variables are combined in a latent growth model, to test hypotheses about correlations in change components. McArdle and Bell (chap. 5, this volume) similarly demonstrate the equivalence of both approaches, demonstrating that analysis based on raw data may be a robust alternative to classical SEM that analyzes covariance matrices when missing data have to be taken into account.
However, despite their similarities, particularly in the latent growth approach, SEM and HLM are not completely interchangeable from the viewpoint of practical data analysis because both have strengths and weaknesses. Although SEM has tremendous flexibility in modeling error structures (Steyer, Partchev, & Shanahan, chap. 6, this volume) and the possibility of modeling mutual influences over time, it is not very easy to analyze nested data structures with it (or it needs a fairly cumbersome setup). This is the domain of HLM, which, in turn, does not allow structuring error components according to a complex measurement structure (or it needs a fairly cumbersome setup). HLM is also more flexible when the repeated measurement occasions vary between individuals.
From a practical standpoint, another important difference between the SEM and HLM approaches is related to the handling of missing data—a feature where HLM was thought to be the more appropriate tool. However, as Wothke (chap. 12, this volume) demonstrates, SEM procedures have narrowed the gap by using full information maximum likelihood estimation of the covariance matrix (as implemented in the latest versions of Amos and Mx). Neale (chap. 14, this volume) extends these consider-ations to modeling the raw data, which may or may not contain patterns of missing-ness. Although further work must be done to demonstrate whether the results from these approaches can be generalized for all possible structures of missingness, these advances clearly broaden the scope of the ways in which such analyses can be adjusted to address different types of research designs.
On the basis of the considerations offered by Graham and Hofer (chap. 11, this volume) about new techniques for data imputation, one might speculate about future integration of imputation techniques in statistical software—not restricted to SEM or HLM programs, of course. In this regard, Arbuckle (chap. 13, this volume) describes some future directions for creating specific procedures that are tailored to handle the specific type of analysis problem of a given design, including issues of missingness. On the other hand, not all data structures can be handled in SEM or HLM procedures. In this respect, the latent transition analyses presented by Collins, Hyatt, and Graham (chap. 8, this volume) provide important alternative statistical procedures that do not assume interval scales—in particular for the latent variables.
As mentioned, a primary goal of this volume is to assist researchers in making decisions, such as what technique to use for what kind of question, when is one technique more appropriate than another, and how does one handle the numerous technical details involved in such procedures. Based on papers that were presented and discussed at a conference in conjunction with a summer school workshop held in Berlin, Germany, in June, 1997, all chapters in this volume address numerous practically relevant questions for empirical social scientists who desire to have an appropriate way to analyze their longitudinal and/or multilevel data. We are indebted to all the contributors to this volume for the tremendous work and gracious generosity that they have extended to this volume.
CHAPTER TWO
Multilevel Analyses of Grouped and Longitudinal Data
Joop J.Hox
University of Amsterdam & Utrecht University
Social and behavioral research often concerns problems that have a hierarchical structure, such as, for example, when individuals are nested within groups. In multilevel analysis, data structures of this nature are viewed as a multistage sample from a hierarchical population. For example, in educational research there may be a sample of schools and within each school, a sample of pupils. This structure results in a data set consisting of pupil data (e.g., socioeconomic status [SES], intelligence, school career) and school data (e.g., school size, denomination, but also aggregated pupil variables such as mean SES). In this chapter, the generic term multilevel is used to refer to analysis models for hierarchically structured data, with variables defined at all levels of the hierarchy. Typically, such research problems include hypotheses of relationships between variables defined at different levels of the hierarchy.
A well-known multilevel model is the hierarchical linear regression model, which is essentially an extension of the familiar multiple regression model. It is known in the literature under a variety of names, such as “hierarchical-linear model” (Bryk & Raudenbush, 1992; Raudenbush & Bryk, 1986), “variance-component model” (Longford, 1989), and “random-coefficient model” (de Leeuw & Kreft, 1986; Longford, 1993). This model has become so popular that “multilevel modeling” has become almost synonymous with “applying a multilevel-regression model.” However, because we also have multilevel extensions of other models, such as factor analysis or structural equation models (SEMs), I reserve the term multilevel model for the general case and refer to specific classes of models as “multilevel regression analysis” and “multilevel SEM,” for example.
THE MULTILEVEL REGRESSION MODEL FOR GROUPED DATA
The multilevel regression model is a hierarchical linear regression model, with a dependent variable defined at the lowest (usually the individual) level and explanatory variables at all existing levels. Using dummy coding for categorical variables, the multilevel regression model can be used for analysis of variance (ANOVA), and it has been extended to include dependent variables that are binary, categorical, or otherwise non-normal data and generalized to include multivariate response models and cross-classified data (cf. Bryk & Raudenbush, 1992; Longford, 1993; and especially Goldstein, 1995).
The Basic Multilevel Regression Model
In most applications, the first (lowest) level consists of individuals, the second level of groups of individuals, and higher levels of sets of groups. Conceptually, the model can be viewed as a hierarchical system of regression equations. For example, assume that data has been collected in j schools, with a different number of pupils nj in each school. On the pupil level, there are the dependent variable yij (e.g., school career) and the explanatory variable xij (e.g., pupil SES). One can set up a regression equation to predict the dependent variable y from the explanatory variable x:
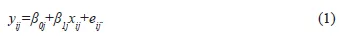
In Equation 1, xij and yij are the scores of pupil i in school j, β0j is the regression intercept, β1j the regression slope, and eij the residual error term. The multilevel regression model depicted in Equation 1 specifies that the different schools are characterized by different regression equations; each school has its own intercept β0j and slope β1j.
Because...
Table of contents
- Cover Page
- Title Page
- Copyright Page
- Preface
- Chapter One: Modeling Longitudinal and Multilevel Data
- Chapter Two: Multilevel Analyses of Grouped and Longitudinal Data
- Chapter Three: A Two-Stage Approach to Multilevel Structural Equation Models: Application to Longitudinal Data
- Chapter Four: Modeling Multivariate Change
- Chapter Five: An Introduction to Latent Growth Models for Developmental Data Analysis
- Chapter Six: Modeling True Intraindividual Change in Structural Equation Models: The Case of Poverty and Children’s Psychosocial Adjustment
- Chapter Seven: Modeling Simultaneously Individual and Group Patterns of Ability Growth or Decline
- Chapter Eight: Latent Transition Analysis as a Way of Testing Models of Stage-Sequential Change in Longitudinal Data
- Chapter Nine: Testing Cross-Group and Cross-Time Constraints on Parameters Using the General Linear Model
- Chapter Ten: Selectivity and Generalizability in Longitudinal Research: On the Effects of Continuers and Dropouts
- Chapter Eleven: Multiple Imputation in Multivariate Research
- Chapter Twelve: Longitudinal and Multigroup Modeling with Missing Data
- Chapter Thirteen: Customizing Longitudinal and Multiple-Group Structural Modeling Procedures
- Chapter Fourteen: Individual Fit, Heterogeneity, and Missing Data in Multigroup Structural Equation Modeling
- References
- About the Authors
Frequently asked questions
Yes, you can cancel anytime from the Subscription tab in your account settings on the Perlego website. Your subscription will stay active until the end of your current billing period. Learn how to cancel your subscription
No, books cannot be downloaded as external files, such as PDFs, for use outside of Perlego. However, you can download books within the Perlego app for offline reading on mobile or tablet. Learn how to download books offline
Perlego offers two plans: Essential and Complete
- Essential is ideal for learners and professionals who enjoy exploring a wide range of subjects. Access the Essential Library with 800,000+ trusted titles and best-sellers across business, personal growth, and the humanities. Includes unlimited reading time and Standard Read Aloud voice.
- Complete: Perfect for advanced learners and researchers needing full, unrestricted access. Unlock 1.5M+ books across hundreds of subjects, including academic and specialized titles. The Complete Plan also includes advanced features like Premium Read Aloud and Research Assistant.
We are an online textbook subscription service, where you can get access to an entire online library for less than the price of a single book per month. With over 1.5 million books across 990+ topics, we’ve got you covered! Learn about our mission
Look out for the read-aloud symbol on your next book to see if you can listen to it. The read-aloud tool reads text aloud for you, highlighting the text as it is being read. You can pause it, speed it up and slow it down. Learn more about Read Aloud
Yes! You can use the Perlego app on both iOS and Android devices to read anytime, anywhere — even offline. Perfect for commutes or when you’re on the go.
Please note we cannot support devices running on iOS 13 and Android 7 or earlier. Learn more about using the app
Please note we cannot support devices running on iOS 13 and Android 7 or earlier. Learn more about using the app
Yes, you can access Modeling Longitudinal and Multilevel Data by Todd D. Little,Kai U. Schnabel,Jrgen Baumert in PDF and/or ePUB format, as well as other popular books in Psychology & History & Theory in Psychology. We have over 1.5 million books available in our catalogue for you to explore.