
- 256 pages
- English
- ePUB (mobile friendly)
- Available on iOS & Android
eBook - ePub
The US Nursing Home Industry
About this book
An in-depth analysis of the nursing home industry in America -- its past, present, and future. It focuses on the business aspects of the industry, and provides a detailed examination of the main issues concerning all nursing homes -- trends in health care expenditures; the legislative history of the industry; growing demand for care and how to measure it; the present structure of the industry; funding and financing concerns; government regulation; inter-industry competition and opportunities for growth; global comparisons; and public policy considerations.
Trusted by 375,005 students
Access to over 1.5 million titles for a fair monthly price.
Study more efficiently using our study tools.
Information
Subtopic
Business GeneralIndex
BusinessChapter 1
National Expenditures on Health and Nursing Home Care
Introduction
The nursing home industry must be viewed in the context of the total health care delivery system. In this way, it will be possible to assess the interrelationships of the industry with the other components of the overall system and consider the potential impact of changes and trends. The quantitative dimension of the analysis begins with a look at the totality of health care expenditures and then proceeds to a sectoral analysis of its major parts. The most important data source for the health care industry is the Health Care Financing Administration (HCFA) of the cabinet-level Department of Health and Human Services (HHS). After examining the current status of the national health care environment and the nursing home sector, we will review several long- and short-term forecasts of the health care industry and its nursing home component.
Overview of Spending Patterns
Recent Data
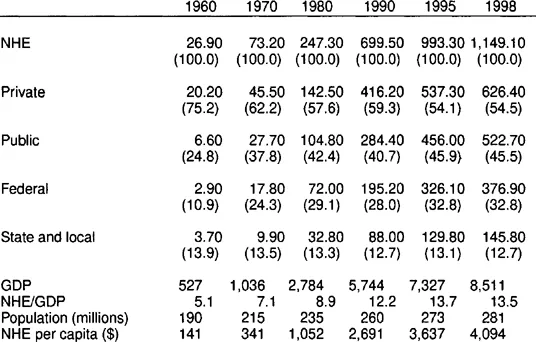
National health expenditures reached $1 trillion for the first time in 1996 and amounted to $1.1 trillion in 1998, the most recent year of data availability (Levit et al. 2000). This figure represented spending of about $4,000 per capita. Despite their large absolute size, health care expenditures have been experiencing a marked deceleration in growth rate during the 1990s. The double-digit year-to-year growth rates that marked the period from 1960 to 1990 have given way to single-digit rates that reached a low of 4.8 percent in 1997. However, the growth rate in 1998 rose to 5.6 percent and raised concerns about a possible reversal of trend. These expenditures, which accounted for 5.1 percent of Gross Domestic Product (GDP) in 1960, rose to 12.2 percent in 1990 and to 13.5 percent in 1998. This measure has been relatively stable since 1993, but increases in private health insurance premiums and the continuing surge in the cost of prescription drugs seem to threaten that stability. Table 1.1 provides some data on national health expenditures over a period of almost four decades.
There are several factors that help account for the slowing rate of growth (Levit et al. 1998). Unquestionably, the move from a fee-for-service to a managed care environment is the most significant. Over 80 percent of employer-sponsored health plan members and a growing portion of public program beneficiaries are involved with some form of managed care. As insurers developed managed care products, they were able to offer lower premiums through tighter control of provider costs and client utilization. They also placed a greater emphasis on preventive care, which would lower future utilization of the health care system. Providers received access to employer-insured groups in exchange for discounts that were negotiated by the insurers. The insurers took advantage of excess capacity in several parts of the health care delivery system, especially the community hospital, which boosted competition and put downward pressure on prices. Furthermore, technological improvements encouraged a shift to outpatient services that were cheaper to deliver than hospital care. Health care expenditures also reflected the declines in both general price inflation and medical price inflation. However, inflation-adjusted health spending growth increased to 4.5 percent in 1998 from less than 3 percent each year in the 1995–97 period (Levit et al. 2000). Measurement of medical price inflation has been enhanced by new producer price indexes used to deflate selected categories of health care expenditures.
Sectoral Details
Hospital and Physician Services
The largest components of health care expenditures have been and continue to be hospital and physician services. In recent years the percentage spent on these services has been declining. In 1997, spending on hospital care increased only 2.7 percent, though it rose to 3.4 percent in 1998. The main factors at work are clearly the shift to managed care and the development of ambulatory alternatives. Since 1990, there has been a 6 percent reduction in hospital admissions per capita and a 16 percent decline in the number of inpatient days in community hospitals. Occupancy rates in community hospitals declined from 64.5 percent in 1990 to 59.6 percent in 1997. This has led to lower negotiated prices for hospital services and encouraged the closing of staffed beds. Conversely, there has been a steady growth in outpatient expenditures—about 10 percent per year since 1993—partially offsetting some of the slow growth in inpatient revenues.
Table 1.1
National Health Expenditures (NHE), Aggregate and Percent, 1960–98, Selected Years (in $ billions)
National Health Expenditures (NHE), Aggregate and Percent, 1960–98, Selected Years (in $ billions)
Though spending on physicians’ services grew 4.4 percent in 1997 and 5.4 percent in 1998, there has been a general slowdown compared to historical trends. The 4.5 percent average annual growth rates from 1992 to 1998 compare with 11.6 percent over the 1960–92 period. The introduction of a prospective payment system (PPS) and tighter controls on fee schedules have had some impact. However, managed care seems to be the major influence. In 1997, the percentage of physicians with managed care contracts rose to 92 percent, up from 88 percent in the previous year. These contracts accounted for 49 percent of physician incomes. A notable trend has been the expanding size of physician practices. The increase in size has provided classic benefits like economies of scale and increased access to capital for the practice of sophisticated, high-tech medicine. A stronger capital base makes it possible to bear the risks of capitated payment arrangements. Group practices offer the possibility of providing a broader range of services at competitive prices, an advantage in negotiating contracts with managed care organizations and employers. Physicians are opting for self-employment in fewer numbers and joining group practices. Self-employed physicians have declined to 57 percent of the total. Of some consequence for the future is the effect of changes in the practice environment on the supply of physicians and their specialties. There have been some recent indications of declining interest in medical education, as well as a surprising softness in the demand for primary care physicians, the backbone of managed care, relative to specialists (Levit et al. 1998).
The Nursing Home Sector
Expenditures for freestanding nursing home care reached $87.8 billion in 1998. This represented 8.6 percent of personal health care spending. The “freestanding” designation is important because the HCFA data on national health expenditures do not include skilled nursing care provided by hospital-based facilities. Such nursing care expenditures are included in the hospital care component of national expenditures. Table 1.2 shows the trends in spending for freestanding nursing home care in absolute terms and as a percentage of national health expenditures. The growth rate for nursing home spending has declined from 13.3 percent in 1990 to 3.7 percent in 1998, the smallest growth rate in almost four decades. This has been attributed to the expanded use of alternative care settings such as home- and community-based care and assisted living. A slow rate of medical price increases is also a factor.
It is important to point out that the above data do not fully reflect the extent of nursing home spending. Table 1.3 presents another data series, based on unpublished Medicare hospital cost reports, cited by Levit et al. (1997). This series isolated the nursing home care component from overall spending on hospital care for the 1990–96 period.
During this period, hospital-based skilled nursing care added from $3.7 to $9.0 billion to total expenditures on nursing home care. When such care is factored in, it accounts for 6.8–10.3 percent of combined expenditures. Moreover, the growth rate in the hospital-based facilities over the period averaged 15.9 percent annually, compared with 7.5 percent for freestanding units. The 1995–96 growth rate for hospital-based and freestanding facilities was 15 percent and 4.3 percent respectively. The deceleration of spending growth was significant for freestanding facilities and small for hospital-based units.
This comparison between freestanding nursing homes and hospital-based units is important since it represents aspects of the continuum of long-term care (LTC). The continuum will be addressed more fully in chapters 7 and 8. However, briefly stated, it represents the various levels of care that are available for persons with chronic conditions. The agencies and facilities of the continuum represent the competitive environment. That environment presents both challenges and opportunities. For the hospital, nursing home services provide an opportunity to replace declining traditional acute hospital services. At the same time, diversification by hospitals is a competitive challenge to the freestanding nursing home. Thus many nursing homes are moving into the area of subacute care in direct competition with hospital-based units.
Table 1.2
Nursing Home Expenditures in the Aggregate and as a Percentage of National Health Expenditures (NHE), Selected Years (in $ billions)
Nursing Home Expenditures in the Aggregate and as a Percentage of National Health Expenditures (NHE), Selected Years (in $ billions)
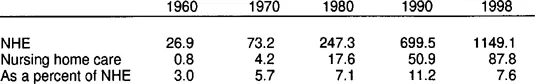
Table 1.3
Total Expenditures for Nursing Home Care by Type of Facility, 1990–96 (in $ billions)
Total Expenditures for Nursing Home Care by Type of Facility, 1990–96 (in $ billions)
| Year | Freestanding | Hospital-based | Total |
| 1990 | 50.9 | 3.7 | 54.7 |
| 1991 | 57.2 | 4.4 | 61.5 |
| 1992 | 62.3 | 5.1 | 67.4 |
| 1993 | 66.3 | 6.1 | 72.4 |
| 1994 | 70.0 | 6.7 | 77.6 |
| 1995 | 75.2 | 7.8 | 83.1 |
| 1996 | 78.5 | 9.0 | 87.5 |
Home Health Care and Prescription Drugs
Two other health care sectors that deserve special mention are home health care and prescription drugs. Home health care is an important sector since it represents a viable alternative to hospital and nursing home care for chronic conditions. Spending on home health care grew as much as 28.2 percent in 1990, and as recently as 1994 this sector had an annual growth rate of 18.9 percent. Since that time, the growth rate has been declining and was negative in 1998 and 1999. Medicare finances 40 percent of all home health services provided by freestanding agencies (as opposed to hospital-based units). Medicare was targeted for reductions in spending by the federal government. The Balanced Budget Act of 1997 (BBA) reduced Medicare payment rates by limiting per visit costs and imposing strict payment amounts based on an interim payment system while a new prospective payment system is developed. Home health care was also targeted by Medicare fraud and abuse initiatives. Recent reports indicate that there has been a reduction in Medicare home health payments far beyond what was intended (Pear 2000b). Recent data compiled by the Congressional Budget Office indicate that these payments declined 14.9 percent in 1998 and 34.9 percent in 1999, amounting to an overall reduction of $32.4 billion in the two fiscal years. A possible unintended consequence that must be examined is longer stays in more expensive hospitals and nursing homes.
It should be noted that a data series comparing spending for hospital-based home health facilities with that for freestanding home health facilities has also been developed and will be presented in chapter 7. The results were similar to the nursing home case. The year-to-year growth rate of spending for the hospital-based units was much greater than that for the freestanding facilities. Also, the share of total spending on home health care for hospital-based units has grown to 20 percent. Home health care is part of the continuum of LTC and presents challenges and opportunities for both hospitals and nursing homes.
It is worth emphasizing that the exclusion of hospital-based services in the standard version of national health care expenditure data underestimates spending and growth rates for both nursing home and home health care. This is a situation that should...
Table of contents
- Cover
- Half Title
- Title Page
- Copyright Page
- Table of Contents
- List of Tables
- Foreword
- Acknowledgments
- Introduction
- 1. National Expenditures on Health and Nursing Home Care
- 2. Legislative and Economic History of the Nursing Home Industry
- 3. Elements of Nursing Home Demand
- 4. Structure of the Nursing Home Industry
- 5. Financing Arrangements and Cost Relationships
- 6. Cost-Containment, Regulation, and Quality Issues
- 7. Competitive Challenges and Opportunities
- 8. Competitive Challenges and Opportunities
- 9. Global Comparisons
- 10. Public Policy Perspectives
- 11. Managerial Issues and Challenges
- References
- Index
- About the Author
Frequently asked questions
Yes, you can cancel anytime from the Subscription tab in your account settings on the Perlego website. Your subscription will stay active until the end of your current billing period. Learn how to cancel your subscription
No, books cannot be downloaded as external files, such as PDFs, for use outside of Perlego. However, you can download books within the Perlego app for offline reading on mobile or tablet. Learn how to download books offline
We are an online textbook subscription service, where you can get access to an entire online library for less than the price of a single book per month. With over 1.5 million books across 990+ topics, we’ve got you covered! Learn about our mission
Look out for the read-aloud symbol on your next book to see if you can listen to it. The read-aloud tool reads text aloud for you, highlighting the text as it is being read. You can pause it, speed it up and slow it down. Learn more about Read Aloud
Yes! You can use the Perlego app on both iOS and Android devices to read anytime, anywhere — even offline. Perfect for commutes or when you’re on the go.
Please note we cannot support devices running on iOS 13 and Android 7 or earlier. Learn more about using the app
Please note we cannot support devices running on iOS 13 and Android 7 or earlier. Learn more about using the app
Yes, you can access The US Nursing Home Industry by Robert A Giacalone in PDF and/or ePUB format, as well as other popular books in Business & Business General. We have over 1.5 million books available in our catalogue for you to explore.