![]()
Part I
Statistical Ideas
Getting Started with the Software
and Using the Computer for
Experimental Details
In my view R is such a versatile tool for scientific computing that anyone contemplating a career in science, and who expects to [do] their own computations that have a substantial data analysis component, should learn R.
John Maindonald (R Help thread, 5 January 2006)
In this chapter I will provide instructions for getting started with both SPSS and R. SPSS—now owned by the IBM corporation and called IBM SPSS Statistics—is probably the most commonly used statistical program in the field of social sciences for which it was originally developed, and is used by many researchers working in the field of second language research. It uses a graphical user interface (GUI) with drop-down menus that should be familiar to those who use programs such as Microsoft Word or Excel. I will also explain how to get started with R, which is the programming language and software environment most statisticians use and has grown greatly in popularity in the last decade, including with linguists. (See an R-lang mailing list created by Roger Levy in 2007, which also contains an archive of all prior messages.) By itself R does not have an intuitive GUI, but in this book I will show you how to use a GUI called R Commander that will help simplify the use of R for beginners.
In this chapter I will first explain how to physically get started by opening the software and either importing or entering your own data into a spreadsheet. (Data are the information you have.) Another important part of getting started is being able to save data. Once you have some data to work with, this chapter then goes on to explain ways you might like to manipulate your data, such as combining columns or calculating percentages, filtering out some cases of participants that you do not want to include in the analysis, or creating new groups from existing columns of data. I will also give you some help as to what to do if you have missing data, and finally, some resources for getting more help with these programs. The SPSS instructions throughout have been tested only with a PC (not Mac) with SPSS. The R instructions have been tested on both a PC and a Mac and any differences between these platforms will be noted in the text or on the website.
1.1 Getting Started with SPSS
First, open SPSS by either clicking on the SPSS icon
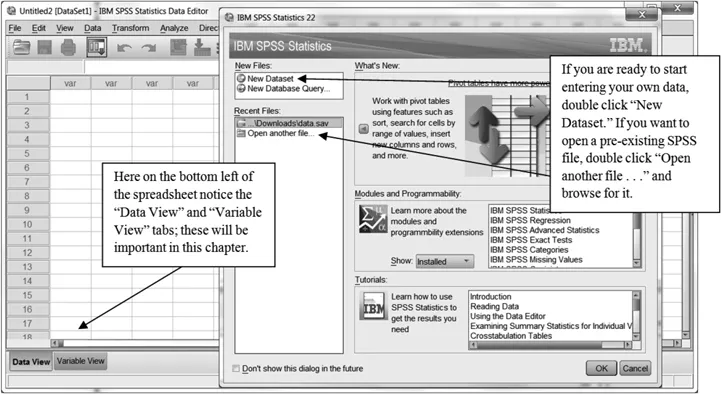
or going through the Programs menu from Windows. When you open SPSS you will see an “SPSS Data Editor” as in
Figure 1.1, which looks like a spreadsheet for entering data. In SPSS version 10.0 and later, before you get to the
Data Editor you will have a pop-up window which tries to help you get started. Usually you will choose either to type in new data or to open up an existing data set, like the ones provided for this book. Data files saved using SPSS have the extension.sav.
Figure 1.1 What you’ll see when starting up SPSS.
Note that there are two tabs in the Data Editor at the bottom of the spreadsheet. One is the “Data View,” which is the default view. The other is the “Variable View.” If you click on this tab, you will see a different spreadsheet that is used to enter specific information about your variables, such as their names, type and number of decimal points you want to see, among others.
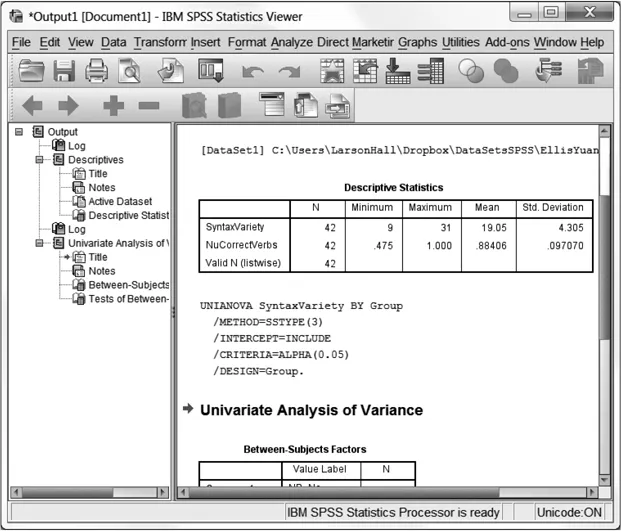
SPSS has two different types of windows. One is the Data Editor, which looks like a spreadsheet and is where you enter your data. The other type of window is where any output appears. This window is called the “Statistics Viewer.” In SPSS, any calls to perform data analysis, such as creating a graph, doing a statistical test or creating a table result in objects automatically appearing in the Statistics Viewer (see Figure 1.2). If you save data from the Statistics Viewer, these files have a.spv extension. (Versions of SPSS older than 16.0 created.spo files as the output files, and these cannot be opened in SPSS 16 unless you install the SPSS 15.0 Smart Viewer, available on the installation CD, according to the SPSS help files.)
Figure 1.2 The Statistics Viewer window.
Section 1.1 deals with entering and importing data into SPSS as well as saving files. If you want information about and practice with manipulating variables in SPSS, such as moving columns or rows or simply deleting them, combining two or more variables into one variable, recoding groups or excluding cases from your data, see the online section titled “Manipulating variables in SPSS.”
1.1.1 Opening a Data File
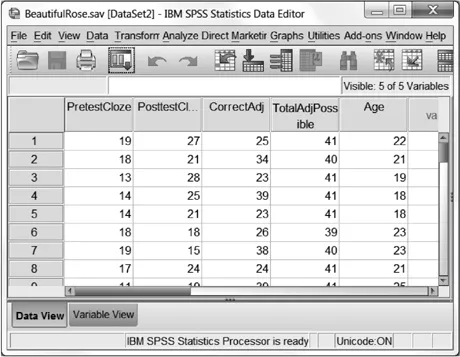
Once you have SPSS open, I am sure you will want to get started trying to do things! If you have not used the initial pop-up menu shown in Figure 1.1 to open a file that has already been created, you can also do this through the menus using the sequence FILE > OPEN > DATA and then navigating to the.sav file you want. If you do this, you will see that the spreadsheet in the SPSS Data Editor becomes filled with data, as shown in Figure 1.3.
Figure 1.3 The Data Editor in “Data View” (“Data View” tab is highlighted at bottom) with data in it.
1.1.2 Entering Your Own Data
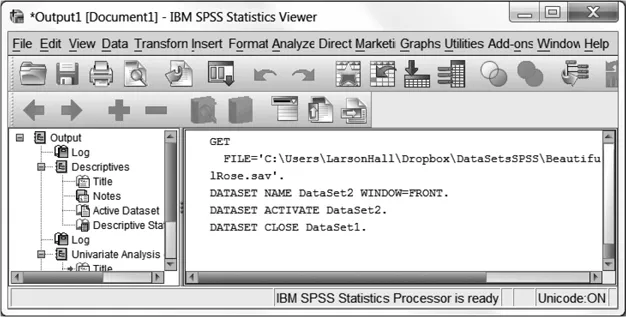
If you are going to create your own data file and would like to open a new spreadsheet through the menu system then you would go to FILE > NEW > DATA, which opens a blank spreadsheet. Since SPSS version 16.0, whenever you carry out any command through the menu system, the SPSS syntax for that command is documented in the Statistics Viewer. For example, Figure 1.4 shows the Viewer after opening up a new file.
There are a few things you need to know about data entry before you start inputting your numbers:
• Rows in SPSS are cases. This means that each participant should occupy one row.
• Columns in SPSS are separate variables, such as ID number, score on a test or category in a certain group.
• You can name each case (participant) by making your first column the ID number of each participant.
Figure 1.4 Command syntax appears in the Statistics Viewer whenever you use a menu sequence, even just opening a blank spreadsheet, as shown here.
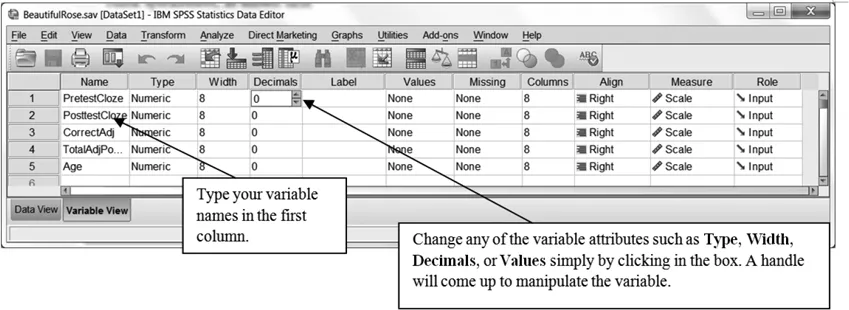
Your first step in entering data is to define the columns, which are your variables. To do this, go to the “Variable View” tab in the lower left-hand corner of the spreadsheet, shown in Figure 1.5 (the format of the spreadsheet will change, and the tab that says “Variable View” will turn yellow). As I will be talking about variables a lot, let me define them here. A variable is a collection of data that all belong to the same sort. For example, the ID numbers of all of your participants are one variable. Their scores on a certain test will be another variable. If the participants belonged to a certain experimental group, that group will be another variable. You can see that a variable, then, can consist of a collection of numbers, non-numeric labels (such as “control” or “group 1”), or just a string of information (such as MQ433 in a participant label).
Figure 1.5 Variable view in SPSS (click the “Variable View” tab at the bottom left corner).
In the Data Editor, when you are looking at the Variable View, you will see the following columns:
When you are naming your variables, you want to give them informative names to make it easier to remember what information is contained in each column. Here are a few things to remember about naming your variables:
• Names can be up to 64 bytes long, resulting in 64 characters for most languages or 32 characters for languages like Japanese, Chinese or Korean (previous versions of SPSS, up to version 12.0, allowed only eight characters).
• Names cannot start with a number.
• Names cannot contain certain characters that are used in SPSS syntax, such as a slash “/”, question mark “?”, exclamation point “!” or quantity sign “>” or “<”). On the other hand, the underscore sign (_), periods and the number sign (#) are fine.
• Names cannot contain blank spaces, such as “My Data File.”
When trying to give your variables informative names it is probably a good idea to use the “every word capitalized” convention, for example, “EnglishSpeakingTest.” This convention makes it easy to read the words. Current versions of SPSS are case-sensitive and will preserve capitalization.
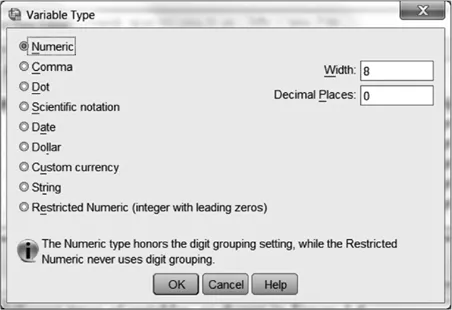
The Type column defines your type of variable. The default choice is Numeric, which means your variable will be a number and can be used in statistical calculations. If you want to make your variable a different type, click on the right side of the cell and a small gray box like the following will appear:
. If you click on the box you will see a choice of many different types of variables, as shown in
Figure 1.6.
Figure 1.6 Variable type choices in the “Variable View” tab of the Data Editor.
I have never actually used any other types besides...