![]()
1 Introduction
1.1 Function of shipping
The function of shipping is the conveyance of goods from where their utility is low to a place where it is higher. Goods may consist of raw materials conveyed in bulk cargo shipments or purpose-built containers, equipment components or parts for assembly at an industrial plant or on-site capital project, like a power station, or the whole range of consumer products, many of which are durable and may be shipped in containers, on swap bodies or by an international trucking operation. A growth area in recent years is outsourcing. This involves manufacturers relocating their industrial plant from a high labour cost economy, such as Germany or the UK, to a low labour cost environment as found in many Far East countries. Components are sourced locally or from neighbouring countries to the industrial assembly plant. Subsequently the products are marketed locally to the major trading centres, such as Europe and North America. Outsourcing is logistically driven and relies primarily on containerized shipment. It exemplifies how shipping is contributing to the growing volume of international trade, the relocation of industry from the developed to the developing economies, as well as to the changing pattern of international trade.
The factors influencing the shipper’s choice of transport mode has changed dramatically since the 1980s. Today it is based on the total product concept embracing all the constituents of distribution logistically driven. These include reliability, frequency, cost, transit time, capital tied up in transport, quality of service, packaging, import duty, insurance, and so on. It favours more strongly multi-modalism, with sea transport undertaking the major leg of the overall transit. Logistics, just-in-time delivery, supply chain management and distribution centres or ‘distriparks’ play a major role in decision-making. All these aspects will be re-examined later as the basis of how the shipowner can best meet the needs of the shipper in the foreseeable future. The paramount consideration is for the shipowner to empathize with the shipper and strive to become flexible and responsive to the shipper’s needs on an innovative value-added basis in a competitive logistic global environment. The freight rate is not the only paramount factor, it is the value-added benefit the shipper gains from the service, which is usually a combined transport operation of road, sea and rail.
1.2 World seaborne trade and world fleet
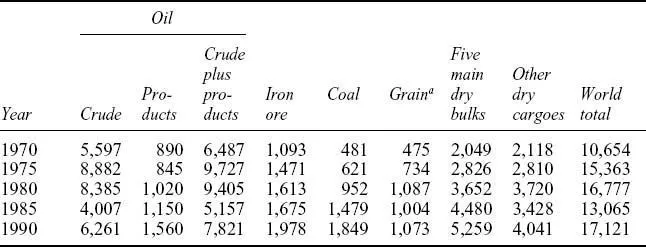
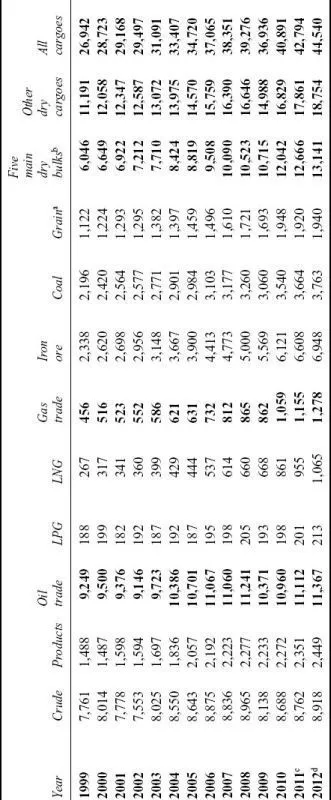
(a) | World seaborne trade (Tables 1.1 and 1.2) during 1990–2010 expanded at an average of 6.5% each year. This figure was reached despite shipping and many other industries during 2008 and 2009 experiencing global recession. For example, during this period oil trade productivity was down 7.7% and in the dry sectors down 10%. These weaker figures reflected the downturn in overall global wealth and demand. Bucking this downward trend, the dry bulk sector continued to expand, though at a reduced rate of 1.8%. Overall the downturn in world seaborne trade was 6%. Yet in 2010 world seaborne trade expanded to reach a peak of 40,891 billion ton-miles, including a strong increase of 10.7% between 2009 and 2010. The average transport distance also increased, thereby improving ship produc tivity. Demand for haulage of crude oil and oil products at this time rose by 5.7%. This figure indicates crude oils being moved longer distances – for example, moving from wells in North and West Africa, Barents, Baltic and Black seas to destinations in Europe and North America. |
| All five main dry bulk cargoes’ ton-miles increased by 12.4%, mainly because of rising and continued Chinese industrial demand. The remaining dry cargoes of minor bulks and extended liner cargo supply lines increased by 12.3%. These signs of greater activity can be attributed to demand by developed countries for merchandise, to the lasting effect of relocated industries in the Far East, and to the longer distances between cargo origins and destinations. However, predictions show a slowing of growth, and figures available for 2010–11 estimate a rise at only 4.7%, while 4.1% is predicted for 2011–12. |
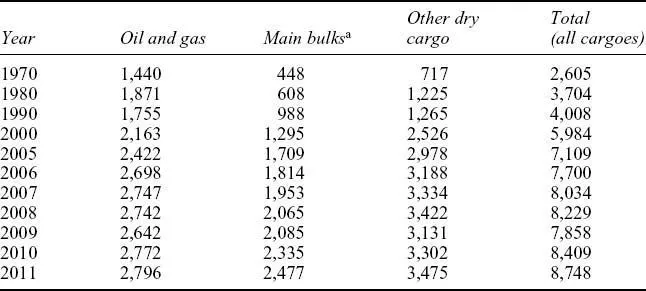
(b) | International seaborne trade (Table 1.3) rose by 7% to 8.4 billion tons of loaded goods in 2010. In 2011 the total of loaded goods is estimated to be 8.74 billion tons, and the growth rate is likely to slacken in subsequent years owing to the slow-down in the Far East economies, especially in China. This decline can be illustrated by tanker shipments of oil and gas, which rose in 2010 by 4.9% to 2.7 billion tons, whereas estimates of growth in 2011 are for only 0.9%. In 2011 it was estimated that Africa’s share of world exports was 9%, America’s 23%, Asia’s 39%, Europe’s 18% and Oceania’s by 11%. In 2004 the main producers of oil and gas were the Russian Federation at 578.6 bcm, United States 549.5 bcm, Canada 180.5 bcm, UK 102.7 bcm, Algeria 82.8 bcm, Iran 70 bcm and Indonesia 72.6 bcm. Other producers are located in the Middle East, Latin America and Asia – often obtaining natural gas as a result of oil production. About 20% of natural gas is exported, mainly by pipelines, which carry 75% of all exports. Many LNG tankers are now in the range of 150,000 m3 instead of the traditional 125,000 m3. Designs for a new type of vessel, the compressed natural gas carrier (CNG), were under inspection in North America and Norway. This carrier would provide a cost-effective solution for supplying gas from remote locations too small to warrant full-scale LNG projects. Oil pipeline construction continues in many oil-producing countries. An example is the 1,770 km pipeline from Baku (Azerbaijan) to Ceyhan (Turkey) on the Mediterranean Sea, which reduces the transit of tankers through the Dardanelles Straits. |
Table 1.1 | World seaborne trade, selected years (billions of ton miles) |
Source: Fearnleys, Review 2004.
Note: a Includes wheat, maize, barley, oats, rye, sorghum and soya beans.
Reproduced with the kind permission of UNCTAD Secretariat.
Table 1.2 | World seaborne trade, 1999–2012 |
Source: Based on data from Clarkson Research Services’ Shipping Review & Outlook, Spring 2012. Reproduced with the kind permission of UNCTAD Secretariat.
Notes: a Includes soybean. b Includes iron ore, coal, grain bauxite/alumina and rock phosphate. c Estimated. d Forecast.
Table 1.3 | Development in international seaborne trade, selected years (millions of tons loaded) |
Sources: Compiled by the UNCTAD secretariat on the basis of data supplied by reporting countries and as published on the relevant government and port industry website, and by specialist sources. The data for 2006 onwards have been revised and upated to reflect improved reporting, including more recent figures and better information regarding the breakdown by cargo type. Figures for 2011 are estimated based on preliminary data or on the last year for which data were available.
Note: a Iron ore, grain, coal, bauxite/alumina and phosphate. The data for 2006 onwards are based on various issues of the Dry Bulk Trade Outlook, produced by Clarkson Research Services.
| In 2011 dry cargo shipments recorded an increase of 5.6% to reach 5.95 billion tons. The five dry bulk trades of iron ore, coal, grains, bauxite/alumina and rock phosphate attained an increase of 6.1% and reached 2.4 billion tons. The remaining dry cargo trades, minor bulks and liner cargoes, increased at a rate of 5.2% to 3.4 billion tons. The share of dry cargo shipments in world seaborne trade was 68% of total goods loaded during the year. |
| As an example, dry cargo... |