Introduction
The use of the term ‘gifted’ is in itself somewhat controversial. It suggests that any form of talent is a gift from God and not subject to change or improvement. We either have it or we do not. It suggests only the highest level of talent is involved and that it is rare. In other words we are in the realms of prodigies such as Mozart and Picasso or Galton and Darwin.
Immediately we can see that few women come to mind yet we know they must exist, as a century of mental testing has demonstrated. In the seventeenth century Angelica Kauffman was more famous and earned more for her paintings than Holbein. She helped found the Royal Academy yet it is the statue of Sir Joshua Reynolds that we see. Ada Lovelace, gifted mathematician (and daughter of Lord Byron), helped develop the first computer program but is only now being rediscovered. The lesson is we must expect equal numbers of girls and boys in any gifted cohort.
Teachers were well aware that there might be a vast range of abilities and talents amongst the children in their classes and yet when the work of NACE and others began many teachers would insist they had never met a gifted child, and some still do!
There is of course a major difference between gifted achievement and gifted potential. Potential is far more difficult to identify and is often hidden or latent, especially in the school years. It has also become clear that there is not only a general range of ability in the population as a whole but there is also a range in the top echelons.
Gagne (1998) found that the wider the range of attributes included as ‘gifts’ or ‘talents’ then the larger the number of children who were likely to be included. He found over several large studies that there were some consistent features: 2 per cent of his subjects appeared as multitalented and nearly 50 per cent were in the top 3 of their groups for at least one attribute. In other words about 50 per cent of children can be regarded as gifted or talented in some respect. Yet in English schools the Department for Education and Employment (DfEE, 1999) instructed that only 5–10 per cent of pupils should receive some form of gifted education provision and be placed on the ‘G and T’ (Gifted and Talented) register.
According to Tannenbaum’s (1993) meta-analysis of research, in order to identify most of the highly able, it is necessary to select the top 15–20 per cent by both ability and attainment and even then some of the most able or gifted will be missed. In the Welsh proposals (Raffan, 2003) the selection of a top 20 per cent is based upon comparisons with the size of the Warnock (1978) special needs group among other considerations.
Giftedness is usually defined as high general intellectual ability such as might be identified using intelligence tests. Talent is used to refer to a high level of ability in a specific performance area such as music, dance or art. It can be used to encompass leadership, communication, design and special mathematical abilities so that some call all high abilities ‘talents’ rather than ‘gifts’.
Creative talent may or may not be associated with a high level of intelligence. Torrance et al. (1963) found that a threshold IQ of only 120 was needed for high creative productive achievement and Cropley (1994) concluded there was no true giftedness without creativity.
Gagne’s (2004) definition in his Developmental Model of Giftedness and Talent (DMGT) is as follows:
Giftedness: designates the possession and use of untrained and spontaneously expressed natural abilities (called outstanding aptitudes or gifts), in at least one ability domain, to a degree that places an individual at least among the top 10 per cent.
Talent: designates the outstanding mastery of systematically developed abilities (or skills) and knowledge in at least one field of human activity to a degree that places an individual at least among the top 10 per cent of age peers who are or have been active in that field or fields.
(p. 120)
The notion of ‘gift’ also raised the fundamental question about whether prodigies were born or made, the nature versus nurture issue. Howe et al. (1998) and Radford (1990) argued that the early histories of prodigies demonstrated significant amounts of practice and nurture. It has led us to believe that with encouragement and education an aptitude can be translated into some form of productive activity or expertise. What this talent might become may also be subject to chance factors (Gagne, 2004).
Identification of giftedness by intelligence tests
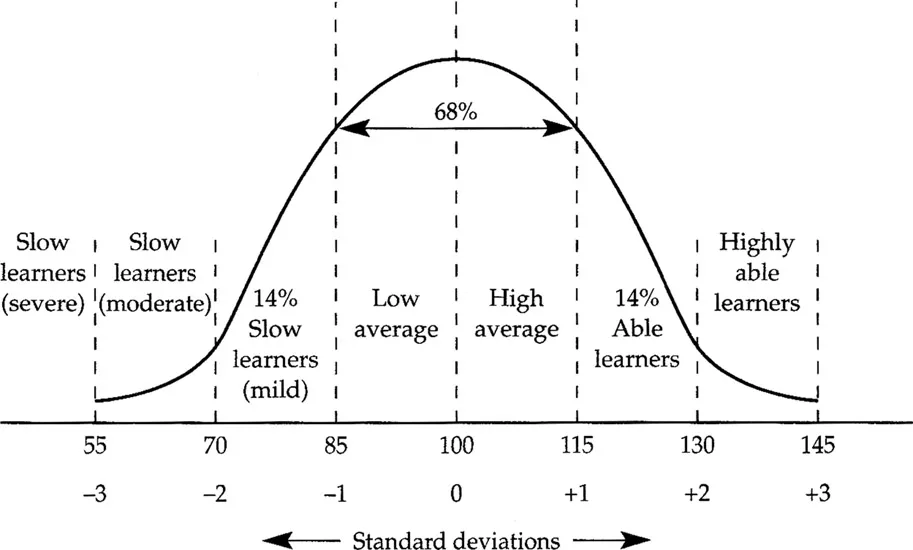
Intelligence in the population as defined by IQ tests follows what is called a normal distribution under an upside down U-shaped curve. All this means is that most people are of average ability and there are fewer who are less able and more able at the two ends of the distribution. The individual’s score on the test is called an intelligence quotient or IQ. Figure 1.1 shows the normal distribution of ability in the population.
The gifted end of the distribution represents about 3 per cent of the population and at the other end of the distribution there is a slight increase over and above 3 per cent thought to be due to birth difficulties and genetic mutations.
Figure 1.1 Normal distribution of ability in the population
IQ tests today are built upon the assumption that the range goes from 0 to 200 with a score of 100 being the mean with standard intervals of 15 points in between.
Scores of 0–55 define those with severe learning difficulties (SLD); 55–70 define those with moderate learning difficulties (MLD); 70–85 define those with mild learning difficulties. The score of 70/72 has been the cut off point for access to ordinary schools depending on the level of basic and social skills acquired. These slower learning children generally have poorer language, thinking and memory skills, hence their poorer scores on IQ tests. They take longer to learn from experience and more of them have coordination and language difficulties than is usual.
Scores of 85–100 are termed ‘low average’, and 100–115 are ‘high average’.
Children with scores 115–130 are often called ‘bright’ or in test terms ‘superior in ability’. Many group IQ tests do not rise above scores of about 135; they have a low ‘ceiling’. In one grammar school visited for work on ‘study skills’ all the ‘A class’ of 32 boys thus had scores between 130 and 134! These may also be called the ‘more able’.
Scores of 130–145 represent the ‘highly superior’ popularly termed ‘gifted’. Only 3 per cent of the school population is predicted to fall into this category but this means we could have at least one in every classroom. They are also called the ‘highly able’ in many English texts on giftedness.
When local authorities were encouraged to make special provision for the gifted in the 1980s they very often established a threshold criterion of 145+ IQ points for referrals. This ensured that very few would meet the criterion and provision would cost as little as possible.
The IQs of the gifted in the top 3 per cent can range from 145–200 but only a few IQ tests give an accurate idea of where in this upper range an individual’s real score falls. Individual tests such as WISC-IV and Binet Form L-M revised extend much further than 145 but WISC for example becomes less reliable at the extremes and can give very different results from Binet that can extend beyond 180. So there is no telling how able the gifted child might be even using these standard test measures.
WISC is now the most widely used IQ test world-wide by psychologists to identify patterns of ability. The Binet test form L-M used to be the most popular but its language bias created limitations in diagnosis especially in relation to socio-educational difficulties. However, IQ tests are tests of what has been learned, not of potential to learn or real world problem solving and creativity. It means that deprived linguistic and cultural environments can depress scores on these tests.
Intellectual or cognitive skills?
Many secondary schools prefer to give ‘cognitive abilities’ tests to their new intakes. It is for them a quicker and easier method for selection and diagnosis than reading the primary school reports. Despite the more mellow title ‘cognitive abilities’ the tests are group tests, or paper and pencil tests based upon intelligence test items.
Intellectual skills are about knowing ‘that’ and knowing ‘how’. They include converting printed words into meaning, fractions into decimals, knowing about classes, groups and categories, laws of mechanics and genetics, forming sentences and pictures. They enable us to deal with the world ‘out there’. Mostly these are taught in schools within subjects and also make up items on intelligence tests (Gagne, 1973).
Cognitive skills are internally organised capabilities that we make use of in guiding our attention, learning, thinking and remembering. They are executive control processes that activate and direct other learning processes. We use them when we think about our learning, plan a course of action and evaluate learning outcomes. These are seldom taught in schools or given value there. They form the basis of wisdom and are seldom tested except in real life situations.
The reasons for making these distinctions is to indicate that intelligence is not only about capacity but also the extent to which skills and knowledge have been taught or absorbed from contact with the environment; they are products of memory. Cognitive skills are different – they are higher order self-regulatory processes – and calling intelligence tests ‘cognitive’ could be a misinterpretation.
Gagne (1998) explained that the figures shown in Table 1.1 were based upon the top 10 per cent in each of four aptitude domains – intellectual, creative, socio-affective, sensorimotor – and possibly emotional intelligence. This means that the total percentage of gifted and talented individuals far exceeds 10 per cent and using peer nomination of multiple abilities he found 50 per cent in a sample of 2,500 of elementary school children.
An IQ score may sound accurate but it is based on a number of subtests made up of various test items all thought to be related in some way to our intelligence. But the inverted U-shaped curve simply demonstrates the random distribution of the errors of measurement. For example as soon as lots of sub-scores in school exams are added together the majority of pupils’ results cluster around the mean with just a few doing well in all subjects. In fact it is misleading to add actual scores to obtain form or class positions; all the scores should first be standardised or brought to the same basis.
Table 1.1 Gagne’s (2004: 131) metric-based system of levels within the gifted education population
| Level | Label | Ratio in general popn. | IQ equivalents | SD |
|
| 5 | Extremely | 1:100,000 | 165 | + 4.43 |
| 4 | Exceptionally | 1:10,000 | 155 | + 3.7 |
| 3 | Highly | 1:1,000 | 145 | + 3.00 |
| 2 | Moderately | 1:100 | 135 | + 2.3 |
| 1 | Mildly | 1:10 | 120 | + 1.3 |
Even though a lot of work goes into an IQ test to standardise it and to make it valid (test what it sets out to) and reliable (consistently give the same score on each occasion), a simple score or set of scores can hardly define us especially if they result from only a paper and pencil test. There are, however, other ways in which giftedness or high ability might be defined to add to test information, such as the following.