Not surprisingly, much has been written about the achievement gap (hereafter referred to as TAG). The extant corpus on TAG ranges in size, depending on the search engine one uses. In June 2014, I conducted a search of the Education Resource Information Center (ERIC) and Psychological Abstracts (PA) databases, using “achievement gap” as the descriptor. Based on a time span from 1962 to 2014, I received 4,177 hits for publications in ERIC and 1,856 in PA. These included publications in which “achievement gap” was in the title or full text. Also, in August 2014, I conducted a Google search with “achievement gap” as the descriptor and received 715,000 hits. Finally, in the summer of 2014, I conducted a computer and hand search for books with the “achievement gap” in the title and located 85 books published between 1954 and 2014.
The following coverage of TAG is organized around three sections: (a) an empirically based overview of eight indicators of TAG (e.g., achievement test performance; school holding power; gifted and talented placement); (b) a summary of several approaches scholars proffer as useful in diminishing TAG; and (c) an overview of the extraordinary growth of people and students of color.
Empirical Overview of TAG
TAG has been well documented, but the literature on it is often scattered and sometimes reports only one achievement indicator in a single document (e.g., reading test performance; as a case in point, see National Center for Education Statistics, 2013a, 2013b). The purpose here is to present data in such a manner that the reader gets a good understanding of the persistent and pervasive nature of TAG as well as a sense of how the data look when all the major indicators of TAG are analyzed in one discussion. I begin by covering the most obvious and frequently reported measure of TAG, achievement test performance. This follows with a presentation of seven other indicators of TAG, which are: (a) grade retention; (b) school holding power; (c) Scholastic Aptitude Test (SAT) scores; (d) matriculation to college; (e) college graduation (baccalaureate and post-baccalaureate); (f) Graduate Record Examination (GRE) scores; and (g) gifted and talented placement. In order to convey the persistent character of TAG, I present, at times, a chronological framing of the data by discussing historical and contemporary information.
1. Achievement test performance. For a long time, it has been widely acknowledged that acquiring literacy and numeracy skills are fundamental to students’ learning, particularly in the early childhood years. Reading is especially important because it is indispensable as a means for students to progress and succeed in other academic domains (U.S. Commission on Civil Rights, 1971). In a classic article written nearly 5 decades ago, Inkeles (1966) developed his “socialization of competence” model, a framework for understanding how one needs to develop “socialized aptitudes” (i.e., skills) to attain a position in the U.S. middle class. Among these skills is developing a command of language, particularly in the forms of reading and writing—that is, literacy. Another skill Inkeles thinks is important is the acquisition of how to interpret mathematical symbols as seen in arithmetic. Furthermore, Finnie and Meng (2006) find that Canadians who dropped out of school tend to have low functional literacy and numeracy skills and that such skills have significant effects—independent of years of schooling attained—on people’s labor market outcomes.
One of the earliest studies on TAG goes back more than 9 decades. Whitney (1923) reports spelling scores (words spelled accurately) by city White and “colored”1 third- through seventh-grade students in segregated schools in Virginia.2 Table 1.1 presents the data. Based on the Ayres spelling test, at every grade level (and all grades combined) TAG favors the White students. A historical study on TAG that is germane to Mexican American children is Drake (1927). He conducted his investigation in Tucson, Arizona, in which 108 White and 95 Mexican American seventh- and eighth-grade students attending the same school served as participants. Table 1.2 shows TAG data based on the Stanford Achievement Test (Form A). As noted, the mean and median scores for Whites are greater compared to their Mexican American peers. Although I do not present the data here, 15.4% of the Mexican American students exceed the White median.3 We need to be mindful of the overlap feature in most studies of TAG. To disregard, or ignore, overlap demeans students of color as it may lead to a stereotype that all such students are low achievers.4
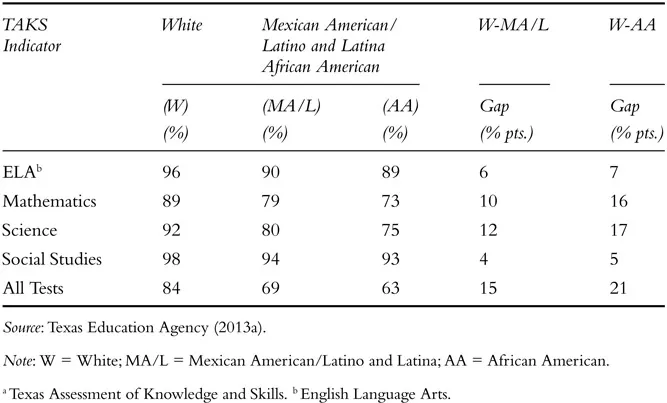
For one of my examples of contemporary data on TAG, I have selected a report from the Texas Education Agency (2013a), a state governmental unit that maintains comprehensive achievement performance disaggregated by ethnicity. Table 1.3 shows data and gaps on various achievement indicators (e.g., English Language Arts; Mathematics; Science) for White, Mexican American/Latino and Latina, and African American students (all grades tested) who met the 2012 standard5 on the Texas Assessment of Knowledge and Skills (TAKS).6 As columns 4 and 5 of Table 1.3 bear out, TAGs for all five subject areas benefit White students. The most consequential TAKS indicator to inspect is “All Tests.” TAG between White and Mexican American/Latino and Latina students is the largest of all measures—at 15 percentage points. TAG between White and African American students is also the greatest of all indicators—at 21 percentage points.
TABLE 1.1 Percentage Gaps on Ayres Spelling Test for White and Colored Students: Virginia, 1923
| Grade and Mean | Race/Ethnicity
| W-C Gap (%pts.) |
| White (W) | Colored (C) |
|
| Grade 3 | | | |
| Mean | 69.6 | 62.4 | 7.2 |
| Grade 4 | | | |
| Mean | 63.8 | 56.2 | 7.6 |
| Grade 5 | | | |
| Mean | 68.3 | 63.5 | 4.8 |
| Grade 6 | | | |
| Mean | 69.5 | 59.5 | 10.0 |
| Grade 7 | | | |
| Mean | 63.1 | 62.9 | 0.2 |
| All Grades Combined | | | |
| Mean | 66.8 | 60.9 | 5.9 |
TABLE 1.2 Mean and Median Gaps on Stanford Achievement Test by White and Mexican Students: Tucson, Arizona, 1927
| Descriptive Statistic | Race/Ethnicity
| Gap (W-M) |
| | White (W) (n = 108) | Mexican (M) (n = 95) | |
|
| Mean | 69.4 | 60.2 | 9.2 |
| Median | 68.9 | 60.5 | 8.4 |
TABLE 1.3 Percentage Gaps on Achievement by White, Mexican American/Latino and Latina, and African American Students Who Met the TAKSa Standard in 2012: Sum of All Grades Tested, Texas, 2012
The analyses of local, geographical, and state statistics to document TAG are certainly helpful. Given, however, that these data are microcosms of a much larger picture, a far more comprehensive method to understand the gravity of TAG is to scrutinize national data. As such, the following presentations of TAG are derived from the most recent reports (2013) of the National Assessment of Educational Progress (NAEP), self-dubbed the “Nation’s Report Card.” I confine this discussion to reading achievement (National Center for Education Statistics, 2013a). To see the data on comparative mathematics achievement, the reader is referred to the National Center for Education Statistics (2013b).7
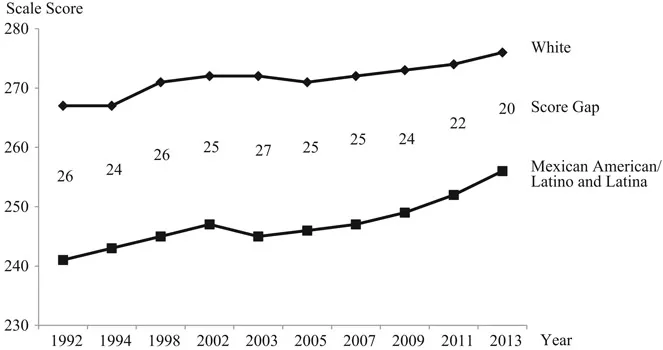
In regard to the most recent NAEP reading data, Figure 1.1 presents a trend analysis of average scores8 for White and Mexican American/Latino and Latina comparisons from 1992 to 2013 for the eighth-grade cohort (National Center for Education Statistics, 2013a). The observed pattern shows that TAGs are relentless, hovering in the middle 20s over the 21 years. Furthermore, in 2011, nationally, 37% of Mexican American/Latino and Latina students perform “below Basic” on reading—compared to 16% of their White peers (National Center for Education Statistics, 2011, p. 96).
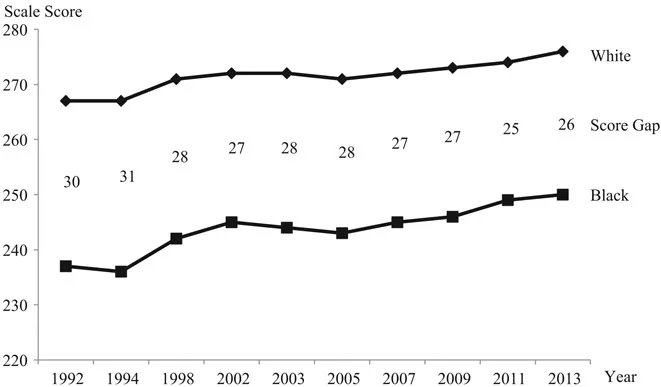
Figure 1.2 shows the NAEP reading scores and gaps for eighth-grade White and Black differentiations from 1992 to 2013. Once again, we see the persistent racialized pattern—TAGs advantage White students. On the whole, TAGs in reading over this 2-decade period linger, generally in the high 20s.9 Regarding the lowest level of reading performance, NAEP reports that in 2011, 42% of Black eighth graders read “below Basic.” By sharp contrast, 16% of White students
FIGURE 1.1 Trends in Eighth-Grade NAEP Reading Scores and Score Gaps, by White and Mexican American/Latino and Latina Groups
Source: National Center for Education Statistics (2013a).
Note: NAEP = National Assessment of Educational Progress.
FIGURE 1.2 Trends in Eighth-Grade NAEP Reading Scores and Score Gaps, by White and Black Groups
Source: National Center for Education Statistics (2013a).
Note: NAEP = National Assessment of Educational Progress.
do so (National Center for Education Statistics, 2011, p. 96). In sum, TAG in NAEP performance in all subject matters doggedly persists for Latino/Latina and Black students, notwithstanding billions of dollars spent yearly on remedial and compensatory intervention programs (Ornstein, 2007). In the context of CRT and in light of structural inequality in society and the schools, one can argue that although funding for academic remediation is important, in and of itself financial infusion is simply not enough to dramatically reduce TAG. Given the deep and widespread oppression low-SES students of color and their families regularly experience, systemic transformations at all levels are needed.
2. Grade retention. This practice of schooling, a euphemism for a student “flunking” a grade, is certainly not new to U.S. public education. Over 100-plus years ago,10 Ayers (1909) in Laggards in Our Schools reports that 16% of the nation’s students were required to “repeat grades.” His conclusion was that “slow progress” was the major reason why repeaters needed to be retained. The pedagogical rationale behind retention is that an extra year at the same grade, or a “gift of time” (Jimerson, Woehr, & Kaufman, 2004), will serve as a powerful curative for the student who is experiencing learning difficulties (e.g., reading significantly below grade level). The extant literature on grade retention, however, finds quite strongly that this policy has not fulfilled its promise of remediation. A body of empirical studies and literature reviews reports that students who are retained, compared to matched peers who are promoted, typically fall behind in academic achievement (e.g., mathematics), make fewer or no gains, seldom or never catch up, have socioemotional and behavioral problems, and tend to drop out of school.11 Another deleterious effect of grade retention is the cost to taxpayers. Writing in 2005, Eide and Goldhaber note that based on an estimate of 2.38 million students retained annually (5%), at a cost of $7,500 per year to educate students, the coffers of public education are drained approximately $17.85 billion dollars per year. Finally, grade retention hits hardest students of color, which I cover next.
The most recent annual report by the Texas Education Agency (2013b) contains TAG grade retention data for AY 2011–2012. Table 1.4 displays the results for K-12 grades, showing a distinct racialized pattern: With the exception of kindergarten, Mexican American/Latino and Latina and Black students have higher retention rates in grade retention relative to their White counterparts.12 At first glance, the grade retention rates (with the exception of ninth-grade percentages) may appear inconsequential because of their small rates. Yet, when looked at in regard to absolute numbers they inform us of the grave toll on individual students—especially students of color. Of the total K-12 Mexican American/Latino and Latina students (n = 2,337,716) enrolled in Texas public schools in 2011–2012, 91,389 (3.9%) experienced retention...