![]()
p.9
Part I
Current state of the air transport sectors
![]()
p.11
1
The global airline industry
John F. O’Connell
Introduction
Over the past century, commercial aviation has shaped the world by growing economic prosperity, stimulating trade, and cultivating tourism development, while its relative affordability in more recent times has allowed it to become an integral part of many people’s lifestyles. Every day throughout the world, over 9 million passengers travel on 104,000 flights over a network of 51,000 routes, while US$17.5 billion worth of goods are transported to industry and homes. Aviation’s global economic impact (direct, indirect, induced and tourism catalytic) is estimated at US$2.7 trillion, equivalent to 3.5 per cent of world gross domestic product (GDP) (ATAG, 2016; IATA, 2016a). The airline industry is characterised by sustained long-term growth in demand for air services. Yet the industry, consisting of around 1,400 airlines globally in 2015 with a combined fleet of over 23,151 aircraft (ATAG, 2016; IATA, 2016a), remains in a financially challenging state, returning only marginal profitability down through the decades. The paradox of sustained long-term growth and only marginal profitability forms the basis for this chapter, which consists of six main sections. The first section briefly investigates the growth, dispersion and segmentation of passenger traffic (the air cargo industry is covered in detail in Chapter 2). The chapter then investigates the profitability of the global airline industry before focusing on the profitability of airlines (see also Chapter 11) domiciled in three main geographical areas: the United States (US), Europe and Asia. The final section provides a conclusion to the chapter.
Growth, dispersion and segmentation of passenger traffic
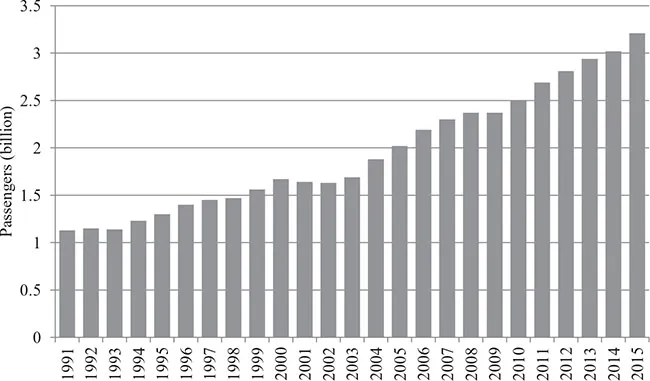
ICAO (2016a) reported that world passenger traffic grew by 6.8 per cent in 2015, 1 per cent higher than in the previous year. This is the highest recorded growth since the post-recession rebound in 2010. The air transport industry is at the epicentre of a wide and far-reaching value chain that encapsulates many industries. For instance, tourism is an important catalytic enterprise in which aviation plays a key role. There were approximately 1.2 billion international tourists in 2015, 54 per cent of whom arrived by air, and this segment of tourists spent US$620 billion on travel, accommodation, food, entertainment and tourist amenities, which have a multiplier catalytic effect into the global economy. Thirty years earlier, only one-third of tourists travelled by air, which highlights the growing interdependency between aviation and tourism that is becoming more and more interwoven (UNWTO, 2016). Figure 1.1 shows that 3.2 billion passengers travelled by air worldwide in 2015 – double the number of passengers since the early 2000s. The expansion of overall global passenger travel during the last 15–20 years is largely attributed to a number of factors, including deregulation (see Chapters 6 and 7), low entry barriers, strengthening global economies, increased disposable income, the ascent of the global middle class, falling fares, the rise of low cost carriers (LCCs), tourism development, including overseas holidaying, and increased international trade, which encourages business travel. Airlines worldwide reacted by adding large amounts of capacity (i.e. seats) in order to capture the increasing passenger traffic.
p.12
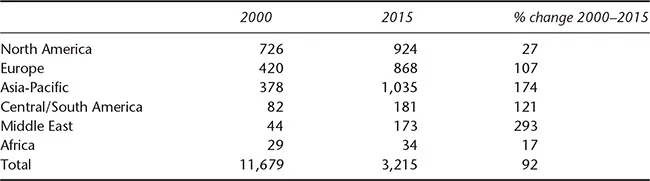
Table 1.1 illustrates the geographical dispersion of these 3.2 billion passengers, with North America recording 924 million passengers, which comprises both domestic and international travellers; however, this market increased by just 27 per cent over the 15-year period from 2000 to 2015. Meanwhile, Europe witnessed the doubling of its traffic over the same time frame, which is attributable to the open sky bloc that was extended to several Eastern European states, thereby removing all restrictions regarding designation, market access and capacity. It liberalised the licensing of carriers, the routes they fly and the prices they can impose, while opening up cross-border and domestic markets (including cabotage) and also removing national ownership restrictions. As a consequence, traffic surged between Eastern and Western Europe. Meanwhile, Asia’s traffic almost tripled from 378 million passengers in 2000 to over 1 billion by 2015, while also accounting for around 40 per cent of the global cargo tonnage. The region is home to 56 per cent of the world’s population, which generates 31 per cent of global GDP. Asia is immersed in economic prosperity, a rapidly rising middle class and populations that are steadily moving into cities. Asia-Pacific nations have been one of the most dynamic tourism markets over the past decade and have become the world’s second most important region in terms of international tourist arrivals (AAPA, 2016; IMF, 2016a).
p.13
Table 1.1 Passenger traffic by region (millions), 2000 versus 2015
Source: Author analysis from ICAO, IATA, AEA, ATA, AAPA, AACO and LCC databases.
Many different categories of passenger travel by air today, and their characteristics and needs are very different from each other. Passenger segmentation data captured by the UNWTO in 2015 found that 53 per cent of passenger boardings were for leisure, recreation and holiday purposes, while 27 per cent were visiting friends and relatives (VFR) or travelling for health and religious purposes, 14 per cent were for business and professional purposes, and the travel purposes of the remaining 6 per cent were not specified (UNWTO, 2016). This varies significantly, however, from region to region and from country to country. For instance, a United Kingdom (UK) international passenger survey in 2015 indicates that 58 per cent of UK residents’ travel abroad by air was for holiday purposes, 21 per cent VFR and 10 per cent business, with other categories constituting the remaining 11 per cent (ONS, 2016).
The underpinning criteria that prompt passengers to take a flight form an imperative and crucial layer of airline research. The International Air Transport Association’s (IATA) global passenger survey report (IATA, 2015a) sampled 7,250 respondents across 140 countries and revealed that the overall top five influences when purchasing a ticket were price (43 per cent), followed by schedule/most convenient flight times (21 per cent), frequent flyer programme (FFP) (13 per cent), global network (9 per cent) and on-time performance (6 per cent). The high proportion of passengers attracted by price is indicative of the rapid rise of LCCs. It is worth noting that when business and leisure passengers were further segmented, the results change considerably. Business passengers’ top five influences were price (36 per cent), schedule (25 per cent), FFP (10 per cent), global network (10 per cent) and on-time performance (11 per cent). Meanwhile, leisure passengers’ top five influences were price (52 per cent), schedule (19 per cent), FFP (8 per cent), global network (8 per cent) and on-time performance (4 per cent) (IATA, 2015b).
Air travel has a bright future ahead of it, with passenger traffic predicted to double over the next 20 years, growing by 4.5 per cent per annum (Airbus, 2016a; IATA, 2016b). In fact, over the last 100 years since the first commercial passenger service in 1914, 65 billion passengers have flown. IATA now expects the next 65 billion will travel in a much shorter time frame in just the next 20 years (IATA, 2014).
These forecasts are endorsed by the significant backlog orders at the three main aircraft manufacturers amounting to 12,884 aircraft by late 2016 comprising 6,749 Airbus aircraft (Airbus, 2016b), 5,635 Boeing aircraft (Boeing, 2016a) and 500 Embraer aircraft (Embraer, 2016) (see Chapter 5). The underpinning drivers for this traffic augmentation include the positive world GDP projections of 2.4 per cent annually over the next 20 years (World Bank, 2016), population expansion, and the inexorable rise of an increasingly affluent middle class and a surge in travel from emerging markets, as 75 per cent of these citizens are forecast to take an air trip by 2035, up from 25 per cent who travelled by air in 2016. Meanwhile, the world’s population is increasingly migrating towards capital cities, where almost two-thirds are projected to reside by 2035 – inhabitants from developed metropolitan cities now treat air travel as a lifestyle.
p.14
Asia-Pacific is singled out as being the source for more than half of the new passengers over the next 20 years, where it will feature in more than half of the top 20 global traffic growth flows. Meanwhile, China will displace the US as the world’s largest aviation market (defined by traffic to/from and within the country), while India will displace the UK for third place by around 2025. Boeing (2016b) envisions that more than 100 million new passengers are projected to board aircraft for the first time in Asia-Pacific, and this will be replicated each year over the coming decades. This is becoming ever more evident as the traffic at Thailand’s 38 airports, for example, has doubled in just six years, and one-third of all traffic from Thailand now goes to China (Airports of Thailand, 2016).
The profitability of the global airline industry
Global airline traffic has been doubling every 15 years since the early 1970s despite the fact that it is fully exposed to many external forces that cause its growth to widely fluctuate. Events such as wars, terrorism, diseases, natural catastrophes, recessions, credit tightening, high inflation and rising oil prices force downward pressure on economic activity, while the opposite occurs for prolonged stock market gains, rising house prices, high employment and so forth. These characteristics all contribute to the cyclical nature of economic activity, which is intrinsically linked to the demand for air travel. From the 1970s to the present day, there has been a number of major cataclysmic events that have adversely affected economic prosperity, and these include the oil crises of the 1970s and late 1980s, the Gulf War in the early 1990s, the Asian financial crisis, SARS, 9/11, the Iraq War, and the severe recession that followed in 2008. In the case of 9/11, for instance, Ito and Lee (2005) found that it led to an ongoing downward shift in demand for commercial air services in the US of roughly 7.4 per cent, after accounting for factors such as trend, seasonality and general macroeconomic conditions.
The full repercussions of Brexit (the UK’s decision to leave the European Union [EU]), will remain unknown over the coming years, but problems are escalating, with Sterling reaching a 31-year low, equivalent to where it traded in March 1985, causing major concerns for UK-domiciled airlines1 that are now exposed to escalating procurement costs (e.g. for fuel, aircraft, and airport fees) that are sourced in foreign currencies. The UK faces a trade-off between accessing the European single aviation market and having the policy freedom to set its own regulations. Taken as a whole, the EU is easily the single biggest destination market from the UK, accounting for 49 per cent of passengers and 54 per cent of scheduled commercial flights according to the author’s estimates. In between these global cataclysmic events, global economies recover, but the cycle of boom years followed by recession is becoming a permanent fixture in the global economic landscape.
Consequently, the demand for air transport is also cyclical in nature as it is synchronised with the economic cycles. Many academics have identified a direct correlation between real GDP (inflation adjusted) and the demand for air travel (see Chapter 19), and this interlink contributes to the cyclical financial performance of the industry. The literature is replete with research inferring to the correlated relationship between air transport developments and economic prosperity from which the financial performance of the world’s airlines show a pendulum-like motion of profit and loss making swings that are directly correlated to global GDP, where air traffic growth is 1.5 to 2 times that of the rate of growth of the economy (e.g. Brueckner, 2003; Button and Taylor, 2000; Chi and Baek, 2013; Chin and Tay, 2001; Debbage and Delk, 2001; Dobruszkes et al., 2011; Doganis, 2010; Marazzo et al., 2010; O’Connell, 2011; Profillidis and Botzoris, 2015; Yao and Yang, 2012).
p.15
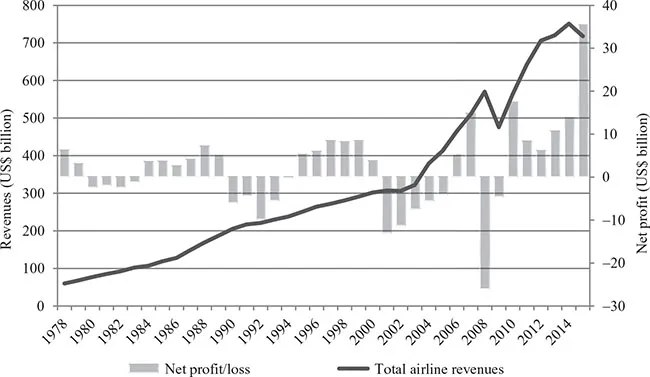
Figure 1.2 shows this oscillating spectrum of profits and losses for the global airline industry from 1978 to 2015. From the inception of the industry in the 1920s to recent years, the ...