- 320 pages
- English
- ePUB (mobile friendly)
- Available on iOS & Android
eBook - ePub
About this book
Now updated for web-based research, the third edition of The Data Game introduces students to the collection, use, and interpretation of statistical data in the social sciences. Separate chapters are devoted to data in the fields of demography, housing, health, education, crime, the national economy, wealth, income and poverty, labor, business, government, and public opinion polling. The concluding chapter is devoted to the common problem of ambiguity in social science statistics.
Trusted by 375,005 students
Access to over 1.5 million titles for a fair monthly price.
Study more efficiently using our study tools.
Information
Subtopic
PoliticsIndex
Social SciencesChapter 1
Introduction
The Purpose of This Book
Social statistics can be frustrating. It seems as if there are numbers to prove anything—even entirely opposite points of view. For example, there are statistics to “prove” that the average U.S. family is becoming richer and that it is becoming poorer; that the crime rate is up and the crime rate is down; that illegal immigration is increasing and that it is decreasing; and that the traditional family is both disappearing and returning.
A quite natural inclination is to reject all statistical results. After all, why trust any number if equally convincing numbers prove precisely the opposite conclusion? This cynical view was summed up by Benjamin Disraeli, who according to Mark Twain listed, in descending order of credibility, “lies, damn lies, and statistics.” Indeed, examples abound in which politicians, journalists, and policy makers fit statistics to their preconceived ideas. This book provides hints to alert readers to ways in which statistics can be misused.
But statistics are more than just sophisticated lies. In most cases the source of contradictory numbers is sincere disagreement between experts. If we can find out why the experts reach different conclusions, we will understand much more about the problem being analyzed. Consider, for example, data on cancer.
The National Cancer Institute maintains the United States is winning the war on cancer because of increases in cancer survival rates and a decline in the cancer death rate for all but the elderly. In contrast, well-respected health statisticians argue that the war on cancer has failed because the overall cancer death rate has not fallen. As described in chapter 4, the statistics each side marshals in its favor are neither right nor wrong; instead, they are based on differing assumptions about which cancers should be counted and what should be expected from a population that is getting older on average and is thus more likely to suffer from such diseases. At stake in this statistical debate are billions of dollars in research funds as well as potentially costly regulations aimed at controlling the incidence of environmentally caused cancers.
Other statistical controversies presented in this book teach a similar lesson. For example, experts disagree about whether the death penalty deters murder, whether mortgage lending is affected by racial discrimination, and whether taxes are becoming more unfair. No book of reasonable length could presuppose to answer these or any of the many other policy questions raised in the following chapters. Instead, the intent here is to show why well-respected researchers are able to reach such contradictory results. In some cases such understanding will help us decide which side is correct; but often it is less important to decide which side is correct than to uncover the complex measurement problems that underlie the issue.
Another purpose of this book is to help researchers, both students and more experienced practitioners, in using social statistics. Consider the following hapless case.
A social science researcher wanted to study the effect of military spending on jobs. Do communities with large military contractors benefit from increased employment, as advocates of military spending argue, or does military spending create relatively fewer jobs than other kinds of government spending, as critics of military spending have charged? To answer this question, the researcher obtained records of military contracts from the U.S. Defense Department arranged by the city where the contractor was located. To measure the number of jobs, the researcher obtained publications of the U.S. Labor Department’s Bureau of Labor Statistics, listing employment by location. Armed with a microcomputer statistical package and all the latest knowledge about statistical probability, the researcher was ready to punch in the numbers and find the answer to his question.
But suddenly the project stalled: just about everything was wrong. The Defense Department data were unusable because they listed contracts by the year in which they were awarded, which was not necessarily the year in which they were spent. To make matters worse, the location where the contract was awarded was not necessarily the location where people were hired. In fact, many contracts were subcontracted to other companies of unknown locale. There were problems with the employment data as well. When one employer dominated the industry, the data were not available on the grounds that the information would betray that company’s trade secrets. Finally, data from the Defense and Labor departments were incompatible because of different definitions of location. The “city” or “metropolitan area” in each survey was not necessarily the same.
I was the ill-informed researcher in this case. But I was not the first researcher whose good idea foundered because of unusable data. It is a recurring complaint in the social sciences that researchers, from the student in training to the advanced scholar, do not know enough about the data they use. By examining the pitfalls encountered by previous researchers, this book will help today’s users of social statistics be more aware of which data sources are available and of the limitations of these data. Had I been aware of the problem of Census Bureau confidentiality frequently encountered by research on business corporations (see chapter 10) before undertaking my failed research on military spending, I would not have expected to find employment data for large firms that dominate a single city’s industry. Similar examples will serve as cautionary tales for other researchers.
In summary, this book is written for two groups of readers. First, it will help everyone who is confused by statistics that seem to prove everything and anything. By sorting out the reasons behind seemingly contradictory statistics, we can better understand the issues under debate. Second, this book will assist researchers in assessing the problems of the underlying data. Without such knowledge, many social science projects will fail, as in the case of my military spending research, or worse, projects will proceed without sufficient caution as to the data’s limitations.
How to Use This Book
Each of the chapters in this book is devoted to a single subject: demography; housing; health; education; crime; national economy; wealth, income, and poverty; labor statistics; business statistics; government; and public opinion polling. Although students of a particular field will find the chapter in that area most useful, the book is intended to be read as a whole. Social scientists work within their own narrow specialty at considerable cost. Most projects use data from outside a narrow discipline, and the data may have limitations that are unknown to the researcher. For example, almost every area in social science measures variables on a per-person basis, a calculation that presupposes accurate population data, which is not necessarily a warranted assumption (as is discussed in chapter 2 on demography). Similarly, geographic units such as Metropolitan Statistical Areas (chapter 3) and corrections of price data for inflation (chapter 11) are common throughout social science research. Thus it is useful for researchers to consult chapters beyond their narrow specialization.
Each chapter opens with a brief overview of the data sources for that area of social science. These sections will acquaint readers with the names of the most important government and private-sector data sources, which statistics they publish, and in many cases an illustrative “data sample.” The names and major publications of these data sources are listed in a table at the opening of each chapter.
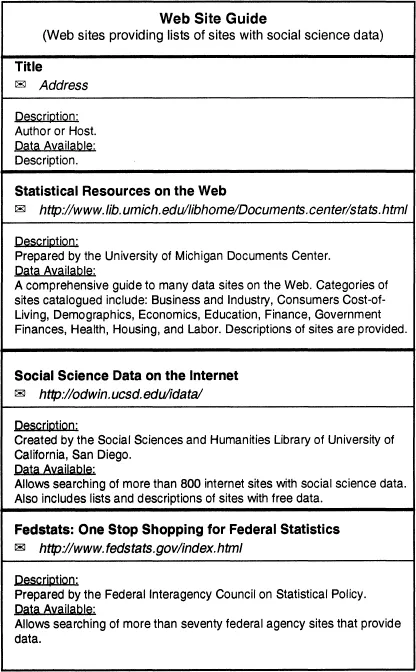
New to the third edition are Web Site Guides, which list and describe electronic data sources available over the World Wide Web. In only a few years electronic access has revolutionized data analysis. Previously, data acquisition involved physical exchange of tapes and disks, or at best downloads through complicated file transfer procedures. Now users have easy access to huge data banks over the World Wide Web, and in many cases access is free. For example, the Integrated Public Use Microdata Series (IPUMS), at the University of Minnesota, has samples drawn from each federal census between 1850 and 1990. One can visit the IPUMS site and download subsamples from those samples (see chapter 2 for more information on this site). Other sites offer remote access to data, so that one can tabulate or calculate descriptive statistics from microdata remotely (for example, see the Public Data Queries site, also discussed in chapter 2).
Because these data sources are so new, there are few good guides to them. For each of the topics covered in this book, University of Portland economist Todd Easton has prepared a list of the most useful Web sites. The entry for each selected site begins with information on the site itself. We give the title of the Web page and the corresponding address, at the recommended level to access the site. (Web page titles are sometimes awkward, but searching for a title may be the best way to find your way to a page if its address changes.) For relatively small sites, access is usually at the top level. For large sites, we give the first page down from the top level from which the route to data is clear. We also identify the organization responsible for the site.
Entries on selected sites also include descriptions of the data available. We let you know if data are available for download and make special note if they are available in an easy-to-use format such as a spreadsheet. To give the reader a sense of the currency of the site, dates are given for data available when the research for this book was done (summer 1998). We note if microdata, as opposed to summary data, are available. For sites with too many data sets to list each, we tried to list the most recent data available, but also kept in mind the sort of data that might be of interest for social scientists using this book.
Within each chapter’s listing of Web sites, we list the sites we consider most valuable first. Value was determined according to two criteria: ease of use and the extent of data available. For students and researchers who wish to pursue additional data available on the Web, we list below Web sites that offer useful links and search capabilities.
Following the “Data Sources” section are “Controversies,” a series of debates about the use of statistics in each area. No attempt is made to cover every debate in each field. Instead, controversies have been selected primarily because they form the basis of recent public policy disputes. These include controversies “in the news,” such as the U.S. Census population undercount, the disappearing middle class, and the number of homeless individuals in the United States. A second criterion for including a controversy was its use as an instructive illustration of a statistical issue. For example, while the rating of individual cities as the best places to live or the lists of the nation’s largest corporations are not particularly critical policy questions, debates about these numbers teach important lessons about the use and misuse of ranking in social statistics.
All the controversies obviously predate the publication of this third edition in 1999. But readers should resist the temptation to reject the examples from past years as out of date. Almost all the debates are ongoing, perhaps with different individuals or institutions, but still involving the same issues. As long as the underlying social and economic system remains the same, controversies based on fundamental measurement problems will stay with us.
Each chapter concludes with “Case Study Questions,” which instructors may assign to students as a means for further learning. These questions are designed to stimulate thought about the issues raised in each chapter. In most cases there is no single “correct” answer; instead, the questions pose problems frequently encountered by researchers. In many instances citations are given for those who want to explore the question in greater depth.
Finally, readers should not overlook the “Notes” sections. There may be found for each subject area recommended guides to data sources, including both official government handbooks and privately published works. For each controversy, references include popular presentations in magazines and newspapers, which are often the most accessible sources and are worth consulting to see how the topic was generally understood—or misunderstood. In addition, there are references to summary reviews of each public policy debate that often appear in academic journals, as well as citations for the key technical articles for each controversy.
Chapter 2
Demography
Demography, the scientific study of population, provides some of the most fundamental social statistics. This chapter looks at demographic controversies about the size of the population, the birthrate, the classification of individuals by race and ethnicity, household characteristics, and the trend in marriage and divorce. These controversies have public policy implications for congressional representation, social security financing, affirmative action, and family law. In addition, because demographic data are used in so many areas of social science, the potential problems described here have implications for research outside the field of demography itself.
In the United States, the major source of demographic data is the U.S. Census, an attempt made every ten years to count each individual, citizen or noncitizen, with or without legal documentation, who resides in the country. Less well known but similarly comprehensive are U.S. Vital Statistics that tabulate most births, deaths, marriages, and divorces. Researchers accustomed to surveys and the problem of sampling error might wonder how there can be controversies about statistics based on complete data. This chapter identifies four major problems: (1) despite valiant efforts to be inclusive, not everyone is counted; (2) the categories used to classify race, ethnicity, and type of household are arbitrary and are therefore subject to debate; (3) the most commonly used categories to describe households leave out significant parts of the population; and (4) demographic data on births, marriage, and divorce sometimes lead to misleading predictions.
Where the Numbers Come From | ||
Organizations | Data sources | Key publications |
Bureau of the Census, U.S. Department of Commerce | U.S. Census | U.S. Census of Population; Statistical Abstract of the United States |
National Center for Health Statistics, U.S. Department of Health and Human Services | U.S. Vital Statistics | Vital Statistics of the United States; Monthly Vital Statistics Report |
Statistics Branch, Immigration and Naturalization Service, U.S. Department of Justice | Records of border crossing and naturalization | Statistical Yearbook of the Immigration and Naturalization Service |
Data Sources
U.S. Census
Collected every ten years since 1790, the U.S. Census is the longest-running consecutive data set in the world. It is also the world’s largest data set, compiling information about the sex, age, marital status, and race of nearly every individual residing in the United States. In addition, about one in six households receives a “long form” asking forty-six additional questions on such diverse matters as occupation and level of education. A number of surveys sponsored by the U.S. government use the census as a statistical base, most notably the Current Population Survey (see chapter 9).
Data Sample: In the 1990 U.S. Census for Hazard, Kentucky, of 5,416 inhabitants, 912 listed English as their ancestry group, 11 listed Hungarian, and 44 listed Swedish.
Because of limited space, only a few questions can be asked on the short form fi...
Table of contents
- Cover
- Half Title
- Title Page
- Copyright Page
- Table of Contents
- List of Figures, Tables, and Boxes
- Preface to the Third Edition
- Acknowledgments
- 1. Introduction
- 2. Demography
- 3. Housing
- 4. Health
- 5. Education
- 6. Crime
- 7. The National Economy
- 8. Wealth, Income, and Poverty
- 9. Labor Statistics
- 10. Business Statistics
- 11. Government
- 12. Public Opinion Polling
- 13. Conclusions
- Notes
- Index
- About the Author
Frequently asked questions
Yes, you can cancel anytime from the Subscription tab in your account settings on the Perlego website. Your subscription will stay active until the end of your current billing period. Learn how to cancel your subscription
No, books cannot be downloaded as external files, such as PDFs, for use outside of Perlego. However, you can download books within the Perlego app for offline reading on mobile or tablet. Learn how to download books offline
Perlego offers two plans: Essential and Complete
- Essential is ideal for learners and professionals who enjoy exploring a wide range of subjects. Access the Essential Library with 800,000+ trusted titles and best-sellers across business, personal growth, and the humanities. Includes unlimited reading time and Standard Read Aloud voice.
- Complete: Perfect for advanced learners and researchers needing full, unrestricted access. Unlock 1.5M+ books across hundreds of subjects, including academic and specialized titles. The Complete Plan also includes advanced features like Premium Read Aloud and Research Assistant.
We are an online textbook subscription service, where you can get access to an entire online library for less than the price of a single book per month. With over 1.5 million books across 990+ topics, we’ve got you covered! Learn about our mission
Look out for the read-aloud symbol on your next book to see if you can listen to it. The read-aloud tool reads text aloud for you, highlighting the text as it is being read. You can pause it, speed it up and slow it down. Learn more about Read Aloud
Yes! You can use the Perlego app on both iOS and Android devices to read anytime, anywhere — even offline. Perfect for commutes or when you’re on the go.
Please note we cannot support devices running on iOS 13 and Android 7 or earlier. Learn more about using the app
Please note we cannot support devices running on iOS 13 and Android 7 or earlier. Learn more about using the app
Yes, you can access The Data Game by Mark Maier,Jennifer Imazeki in PDF and/or ePUB format, as well as other popular books in Social Sciences & Politics. We have over 1.5 million books available in our catalogue for you to explore.