There is growing acceptance that the progress delivered under the Millennium Development Goal target for drinking water and sanitation has been inequitable. As a result, the progressive reduction of inequalities is now an explicit focus of the Sustainable Development Goal (SDG) targets, adopted in 2015, for universal access to drinking water, sanitation and hygiene (WASH). This shift in focus has implications for the way in which the next generation of WASH policies and programmes will be conceived, designed, financed and monitored.
This book provides an authoritative textbook for students, as well as a point of reference for policy-makers and practitioners interested in reducing inequalities in access to WASH services. Four key areas are addressed: background to the human right to water and development goals; dimensions of inequality; case studies in delivering water and sanitation equitably; and monitoring progress in reducing inequality.
Trusted by 375,005 students
Access to over 1.5 million titles for a fair monthly price.
Equality as a global priority for the water and sanitation sector
1
PROGRESS IN TRACKING INEQUALITIES
Lessons from MDG monitoring
Robert Bain and Tom Slaymaker
Introduction
As attention shifts from the Millennium Development Goals (MDGs) to the Sustainable Development Goals (SDGs), it is important to reflect on global monitoring of inequalities prior to and during the MDG period. This chapter reviews the evolving definitions of access and services used for international monitoring since the early 1990s, and the types of inequalities that have been monitored to date, with a focus on reporting of access to drinking water, sanitation and hygiene (WASH) at global level by the WHO/UNICEF Joint Monitoring Programme (JMP) for Water Supply, Sanitation and Hygiene. It describes several limitations of existing data and points to areas where inequality monitoring should be strengthened during the SDG era. The chapter provides a context within which to understand the ambition of the SDGs related to WASH (Chapter 3) and other related sectors (Chapter 11) while serving to underscore the need to go beyond access and progressively measure the levels of service (Chapter 12).
Evolving definitions of access and services used by the JMP
The WHO/UNICEF JMP has tracked progress in water, sanitation and hygiene since it was founded in the early 1990s. Mandated to monitor WASH at global, regional and national levels, the definitions of access and service levels used by the JMP have evolved in tandem with progress sector monitoring.
In its first decade (1990–2000), the JMP relied on questionnaires sent to line ministries responsible for WASH that were often completed based on administrative data. JMP questionnaires described ‘safe drinking water coverage’ as the proportion of population with access to an adequate amount of safe drinking water located within a convenient distance for the user’s dwelling, and ‘sanitary means of excreta disposal’ as the proportion of population with access to a sanitary facility for human excreta disposal in the dwelling or located within a convenient distance from the user’s dwelling and noted that countries should use local definitions of terms like ‘safe’, ‘sanitary’ and ‘convenient’.1
Early reports focused on trends in national, urban and rural coverage for developing regions. However, given the diverse definitions used in different countries, a key objective was to establish a suitable common benchmark to allow for international comparison of status and trends over time. This was further underlined by the call for more robust estimates to inform international target setting. The Millennium Summit and the World Summit on Sustainable Development established new global targets for drinking water and sanitation under the framework of the Millennium Development Goals (MDGs).2,3 No specific mention of hygiene was made in the target or declaration. Target 7C under the goal for ensuring environmental sustainability sought to ‘Halve, by 2015, the proportion of the population without sustainable access to safe drinking water and basic sanitation’ (source: United Nations4).
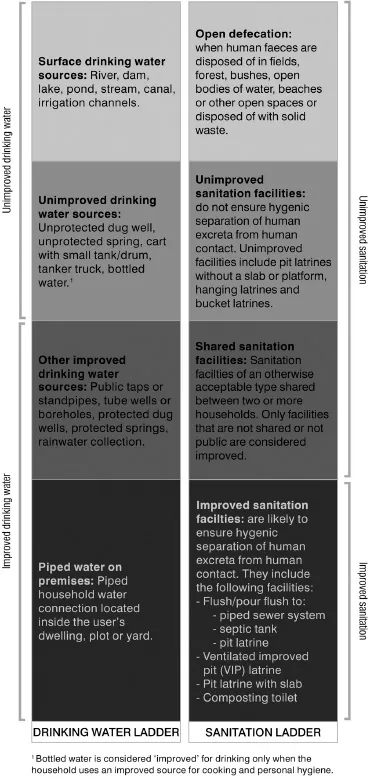
The JMP proposed a simple technology-based approach to classifying drinking water and sanitation facilities as ‘improved’ or ‘unimproved’ (Table 1.1). Improved drinking water sources are those designed to ‘protect’ the supply from outside contamination – in particular, faecal contamination. Improved sanitation facilities are those designed to prevent human contact with faeces. The improved classification was developed through a series of expert consultations and the terminology, if not the exact classification of technology types, pre-dated the MDGs.5 It was further refined in the early 2000s to distinguish specific types of sanitation facilities such as flush/pour flush and hanging latrines, and water sources such as piped water into a dwelling, plot or yard, as well as the use of bottled water and tanker trucks.
WASH sector stakeholders rallied around the improved indicator and the comparatively small number of global MDG targets provided a renewed emphasis on progress on basic water and sanitation services. The ‘improved’ indicator is simple and easy to communicate, which has facilitated its use for both decision making and advocacy. By becoming a de facto global norm, however, a growing number of criticisms were raised related to reductionism (Box 1.1). A further general criticism has been the focus on average rates of progress and the formulation of the target to ‘halve the proportion without’ which together enable target achievement without a dedicated focus on reducing inequalities and reaching poor and marginalised groups.7
In 2006, the JMP published guidance for household survey programmes in the form of ‘core questions’ (Table 1.2). This supported the increasing harmonisation across major international survey programmes such as Multiple Indicator Cluster Surveys (MICS), Demographic and Health Surveys (DHS) and Living Standard Measurement Study (LSMS). The questions have since been promoted by the JMP and sector stakeholders and, as a result, have been adopted in many other national household surveys and a subset was also included in the 2010 round of censuses in low- and middle-income countries. The harmonisation of core questions has led to a great increase in the quality and quantity of data from households as well as comparability of survey results.
TABLE 1.1 MDG Improved classification
Improved
Unimproved
Drinking water
Piped water into dwelling,
plot or yard Public tap/standpipe
Tubewell/borehole
Protected dug well
Protected spring
Rainwater collection
Unprotected dug well
Unprotected spring
Cart with small tank/drum
Bottled water1
Tanker truck
Surface water (river, dam, lake, pond, stream, canal, irrigation channels)
Sanitation2
Flush/pour flush to: piped sewer system, septic tank, pit latrine; unknown place/not known where.
VIP latrine
Pit latrine with slab
Composting toilet
Flush/pour flush to: elsewhere.
Pit latrine without slab/open pit
Bucket
Hanging toilet/hanging latrine
No facilities or bush or field
Notes
1Bottled water is considered improved only when the household uses water from an improved source for cooking and personal hygiene.
2Shared or public facilities are not counted as improved.
Source: WHO/UNICEF (2006).6
BOX 1.1THE IMPROVED DICHOTOMY
The improved/unimproved classification has proven to be readily applicable in almost all countries. It has nevertheless been criticised for being too high for low-income countries – e.g. where the majority still use ‘traditional’ latrines without a slab – and too low for high-income countries – e.g. with high rates of coverage with piped water and sewerage infrastructure but poor service levels. Specifically, it is widely recognised that while improved drinking water sources are less likely to be contaminated, this does not necessarily imply that they are ‘safe’ to drink. The use of a single threshold has also been criticised because it does not adequately reflect progress above and below the benchmark. But perhaps most importantly it is recognised that service levels vary widely among households using any given type of improved facility.8
TABLE 1.2 JMP core questions
Drinking water
Main source of drinking water1 Time to collect drinking water per round trip Person primarily responsible for collecting water Household water-treatment practices
Sanitation
Main sanitation facility Sharing sanitation with other households Number of households sharing Child faeces disposal practices
Note
1The core questions recommended recording information on the household’s source for other purposes, such as cooking and hand washing if bottled water was reported as main source of drinking water.
Source: WHO/UNICEF (2006).6
In its 2008 report, the JMP introduced a new approach to monitoring trends in the use of water and sanitation. The drinking water and sanitation service ‘ladders’ represented an important shift by enabling the JMP to track trends and highlight inequalities in both higher and lower levels of service. For drinking water, this ranged from the use of surface water to piped water on premises – the highest level of service monitored during the MDGs. For sanitation, rungs below improved were introduced (shared, unimproved, open defecation), but there was no equivalent higher service level. Efforts to monitor sanitation rungs below improved corresponded with increased global attention to sanitation reflected in the 2008 International Year of Sanitation and the establishment of the Sanitation and Water for All global partnership. The bottom rung in particular was important in drawing attention to the practice of open defecation, now a major focus of the sector.
The shift to the use of household surveys and censuses as the main source of data on drinking water and sanitation at the outset of the MDG period necessitated the development of new methods and in turn enabled more statistically robust comparisons of progress between and within countries.10 Censuses are typically decadal and household surveys are usually conducted every three to five years. Moreover, sampling and non-sampling errors mean that estimates often vary between surveys. For these reasons, simply using the latest survey for all countries would have meant comparisons between data points many years apart (>5 years). Given the limited amounts of data and the need to be able to clearly articulate the methodology to the sector and government counterparts, the JMP adopted a simple method based on linear regression (Box 1.2).9 By producing modelled estimates for any given year, it was possible to compare coverage in the same year and to compare trends for the same time periods.
FIGURE 1.1 JMP drinking water and sanitation ladder
Source: WHO/UNICEF JMP (2015).9
BOX 1.2JMP METHOD
The JMP produces estimates using a linear regression method in order to compare estimates for different countries in a single reference year. Trends are extrapolated by at most two years and beyond this point the estimates remain unchanged for up to four years unless coverage is below 0.5 pe...
Table of contents
Cover
Half Title
Title Page
Copyright Page
Table of Contents
Preface
List of contributors
Part 1 Equality as a global priority for the water and sanitation sector
Part 2 Dimensions of inequality related to water and sanitation
Part 3 Addressing inequality in water and sanitation service provision
Part 4 Enhanced monitoring of inequalities in water and sanitation
Index
Frequently asked questions
Yes, you can cancel anytime from the Subscription tab in your account settings on the Perlego website. Your subscription will stay active until the end of your current billing period. Learn how to cancel your subscription
No, books cannot be downloaded as external files, such as PDFs, for use outside of Perlego. However, you can download books within the Perlego app for offline reading on mobile or tablet. Learn how to download books offline
Perlego offers two plans: Essential and Complete
Essential is ideal for learners and professionals who enjoy exploring a wide range of subjects. Access the Essential Library with 800,000+ trusted titles and best-sellers across business, personal growth, and the humanities. Includes unlimited reading time and Standard Read Aloud voice.
Complete: Perfect for advanced learners and researchers needing full, unrestricted access. Unlock 1.5M+ books across hundreds of subjects, including academic and specialized titles. The Complete Plan also includes advanced features like Premium Read Aloud and Research Assistant.
Both plans are available with monthly, semester, or annual billing cycles.
We are an online textbook subscription service, where you can get access to an entire online library for less than the price of a single book per month. With over 1.5 million books across 990+ topics, we’ve got you covered! Learn about our mission
Look out for the read-aloud symbol on your next book to see if you can listen to it. The read-aloud tool reads text aloud for you, highlighting the text as it is being read. You can pause it, speed it up and slow it down. Learn more about Read Aloud
Yes! You can use the Perlego app on both iOS and Android devices to read anytime, anywhere — even offline. Perfect for commutes or when you’re on the go. Please note we cannot support devices running on iOS 13 and Android 7 or earlier. Learn more about using the app
Yes, you can access Equality in Water and Sanitation Services by Oliver Cumming, Tom Slaymaker, Oliver Cumming,Tom Slaymaker in PDF and/or ePUB format, as well as other popular books in Economics & Sustainable Development. We have over 1.5 million books available in our catalogue for you to explore.