Programmers develop software applications every day in order to increase efficiency and productivity in various situations. LabVIEW, as a programming language, is a powerful tool that can be used to help achieve these goals. LabVIEW (Laboratory Virtual Instrument Engineering Workbench) is a graphically-based programming language developed by National Instruments. Its graphical nature makes it ideal for test and measurement (T&M), automation, instrument control, data acquisition, and data analysis applications. This results in significant productivity improvements over conventional programming languages. National Instruments focuses on products for T&M, giving them a good insight into developing LabVIEW.
This chapter will provide a brief introduction to LabVIEW. Some basic topics will be covered to give you a better understanding of how LabVIEW works and how to begin using it. This chapter is not intended to teach beginners LabVIEW programming thoroughly. Those wishing to learn LabVIEW should consider attending a National Instruments LabVIEW Basics course. Relevant information on the courses offered, schedules, and locations can be found at www.ni.com/training. If you have prior experience with LabVIEW, you can skip this chapter and proceed to the advanced chapters.
First, VIs and their components will be discussed, followed by LabVIEW’s dataflow programming paradigm. Then, several topics related to creating VIs will be covered by explaining the front panel and block diagram. The chapter will conclude with descriptions of icons and setting preferences.
1.1 VIRTUAL INSTRUMENTS
Simply put, a Virtual Instrument (VI) is a LabVIEW programming element. A VI consists of a front panel, block diagram, and an icon that represents the program. The front panel is used to display controls and indicators for the user, and the block diagram contains the code for the VI. The icon, which is a visual representation of the VI, has connectors for program inputs and outputs.
Programming languages such as C and BASIC use functions and subroutines as programming elements. LabVIEW uses the VI. The front panel of a VI handles the function inputs and outputs, and the code diagram performs the work of the VI. Multiple VIs can be used to create large scale applications, in fact, large scale applications may have several hundred VIs. A VI may be used as the user interface or as a subroutine in an application. User interface elements such as graphs are easily accessed, as drag-and-drop units in LabVIEW.
1.1.1 The Front Panel
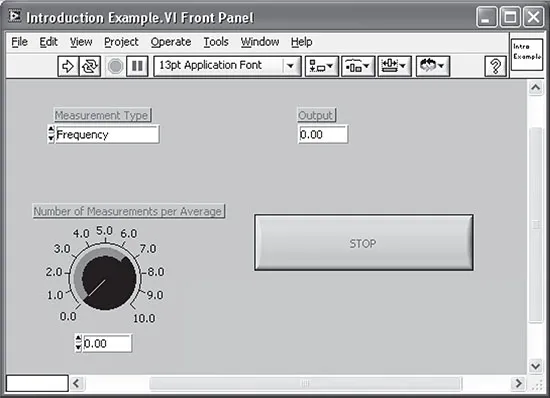
Figure 1.1 illustrates the front panel of a LabVIEW VI. It contains a knob for selecting the number of measurements per average, a control for selecting the measurement type, a digital indicator to display the output value, and a stop button. An elaborate front panel can be created without much effort to serve as the user interface for an application. Front panels and LabVIEW’s built-in tools are discussed in more detail in Section 1.5.
1.1.2 Block Diagram
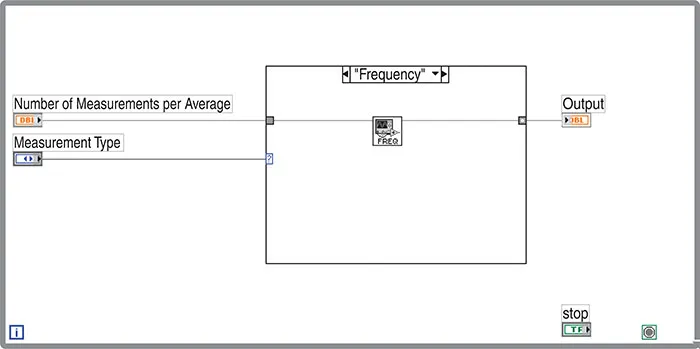
Figure 1.2 depicts the block diagram, or source code, that accompanies the front panel in Figure 1.1. The outer rectangular structure represents a While loop, and the inner one is a case structure. The icon in the center is a VI, or subroutine, that takes the number of measurements per average as input and returns the frequency value as the output. The orange line, or wire, represents the data being passed from the control into the VI. The selection for the measurement type is connected, or wired to the case statement to determine which case is executed. When the stop button is pressed, the While loop stops execution. This example demonstrates the graphical nature of LabVIEW and gives you the first look at the front panel, block diagram, and icon that make up a Virtual Instrument. Objects and structures related to the code diagram will be covered further in Section 1.6.
LabVIEW is not an interpreted language; it is compiled behind the scenes by LabVIEW’s execution engine. Similar to Java, the VIs are compiled into an executable code that LabVIEW’s execution engine processes during runtime. Every time a change is made to a VI, LabVIEW constructs a wire table for the VI. This wire table identifies elements in the block diagram that have inputs needed for that element to run. Elements can be primitive operators such as addition, or more complex such as a subVI. If LabVIEW successfully constructs all the wire tables, you are presented a solid arrow indicating that the VIs can be executed. If the wire table cannot be created, then a broken arrow is presented for the VIs with a problem, and also for each VI loaded in memory that requires that VI for execution. LabVIEW runs in several subsystems, which will be described throughout this book. All that we need to understand now is that the main execution subsystem compiles diagrams while you write them. This allows programmers to write code and test it without needing to wait for a compiling process, and programmers do not need to worry about execution speed because the language is not interpreted.
The wire diagrams that are constructed do not define an order in which elements are executed. This is an important concept for advanced programmers to understand. LabVIEW is a dataflow-based language, which means that elements will be executed in a somewhat arbitrary order. LabVIEW does not guarantee which order a series of elements is executed in if they are not dependent on each other. A process called arbitrary interleaving is used to determine the order elements are executed in. You may force an order of execution by requiring that elements require output from another element before execution. This is a fairly common practice, and most programmers do not recognize that they are forcing the order of execution. When programming, it will become obvious that some operations must take place before others can. It is the programmer’s responsibility to provide a mechanism to force the order of execution in the code design.
1.1.3 Executing VIs
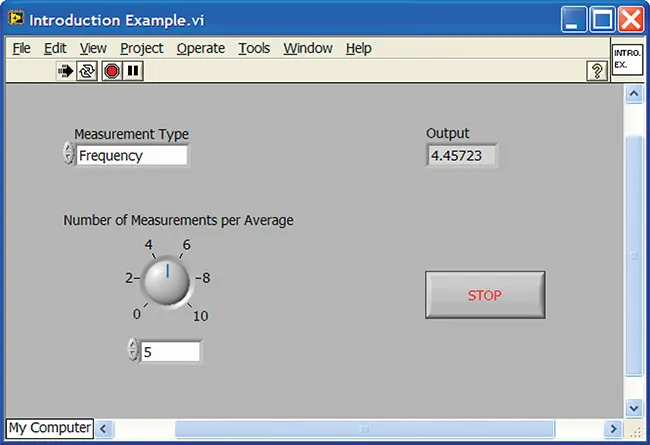
A LabVIEW program is executed by pressing the arrow or the Run button located in the palette along the top of the window. While the VI is executing, the Run button changes to a black color as depicted in Figure 1.3. Note that not all of the items in the palette are displayed during execution of a VI. As you proceed to the right along the palette, you will find the Continuous Run, Stop, and Pause buttons. If you compare Figures 1.1 and 1.3, the last three buttons in Figure 1.1 disappear in Figure 1.3. These buttons are used for alignment of objects on the panel or diagram, and are not available while a program is running. VIs are normally run from the front panel; however, they can also be executed from the block diagram. This allows the programmer to run the program and utilize some of the other tools that are available for debugging purposes.
If the Run button appears as a broken arrow, this indicates that the LabVIEW program or VI cannot compile because of programming errors. When all of the errors are fixed, the broken Run button will be substituted by the regular Run button. LabVIEW has successfully compiled the diagram. While editing or creating a VI, you may notice that the palette displays the broken Run button. If you continue to see this after editing is completed, press the button to determine the cause of the errors. An Error List window will appear displaying all of the errors that must be fixed before the VI can compile. Debugging techniques are discussed further in Chapter 6, which covers exception handling.
The palette contains four additional buttons on the block diagram that are not available from the front panel. These are typically used for debugging an application. The button with the lightbulb is for Execution Highlighting and the three following it are used for stepping through the code. Figure 1.4 shows the code diagram with Execution Highlighting activated. You can see bubbles that represent the data flowing along the wire, from one block to the next. You can step through the code as needed when the Pause button is used in conjunction with Execution Highlighting. As stated earlier, debugging techniques will be covered in Chapter 6.
1.1.4 LabVIEW File Extensions
LabVIEW programs utilize the .vi extension. However, multiple VIs can be saved into library format with the .llb extension. Libraries are useful for grouping related VIs for file management. When loading a particular VI that makes calls to other VIs, the system is able to find them quickly. Using a library has benefits over simply using a directory to group VIs. It saves disk space by compressing VIs, and facilitates the movement of VIs between directories or computers. When saving single VIs, remember to add the .vi extension. If you need to create a library for a VI and its subVIs, you will need to create a source distribution using the LabVIEW Project. If you want to create a new library starting with one VI, you can use Save or Save As. Then select New VI Library from the dialog box. The File Manager can then be used to add or remove VIs from a library.
1.2 LABVIEW PROJECTS
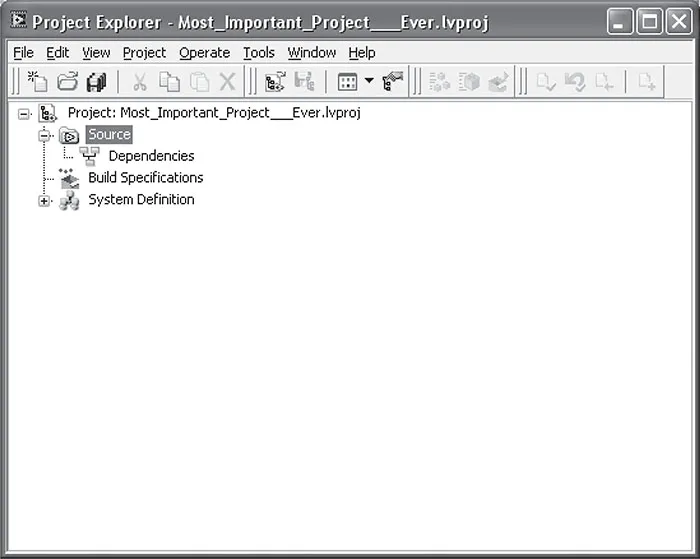
Among other features in LabVIEW 8, the one you should be interacting with daily is the project view. LabVIEW’s new project view provides a convenient interface to access everything in a LabVIEW project. Historically, locating all the Vis in an application has required the use of the hierarchy window, but that does not locate some things like LabVIEW libraries and configuration of the application builder. The project explorer provides a tree-driven list of all of these. The set of VI sources and libraries are shown in the first major breakdown: the Source tree. Information related to compilation and installation of an application are kept in the second branch of the tree: Build Specifications. Information relating to the target machine environment you are building an application to is located in the last branch: System Definition. Applications that use the same operating system as the development platform will not find the System Definition folder to be of value. If a compile target is something like a Palm Pilot, then this folder is where definitions specific to a Palm based target would be configured. The project window is shown in Figure 1.5.
Among other things worth noting on the project explorer window is the toolbar, which contains buttons to create, save, and save all VIs in the application; compile; th...