![]()
1
Introduction
The basic idea behind dynamic documents stems from literate programming, a programming paradigm conceived by Donald Knuth (Knuth, 1984). The original idea was mainly for writing software: mix the source code and documentation together; we can either extract the source code out (called tangle) or execute the code to get the compiled results (called weave). A dynamic document is not entirely different from a computer program: for a dynamic document, we need to run software packages to compile our ideas (often implemented as source code) into numeric or graphical output, and insert the output into our literal writings (like documentation).
We explain the idea with a trivial example: suppose we need to write the value of 2π into a report; of course, we can directly write the number 6.2832. Now, if I change my mind and I want 6π instead, I may have to find a calculator, erase the previous value, and write the new answer. Since it is extremely easy for the computer to calculate 6π, why not leave this job to the computer completely and free oneself from this kind of manual work? What we need to do is to leave the source code in the document instead of a hard-coded value, and tell the computer how to find and execute the source code. Usually we use special markers for computer code in the source report; e.g., we can write
The correct answer is {{ 6 * pi }}.
in which {{ and }} is a pair of markers that tell the computer 6 * pi is the source code and should be executed. Note here pi (π) is a constant in R.
If you know a Web scripting language such as PHP (which can embed program code into HTML documents), this idea should look familiar. The above example shows the inline code output, which means source code is mixed inline with a sentence. The other type of output is the chunk output, which gives the results from a whole block of code. The chunk output has much more flexibility; for example, we can produce graphics and tables from a code chunk.
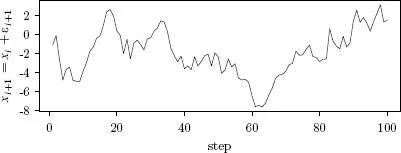
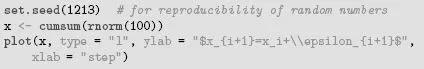
Figure 1.1 was dynamically created with a chunk of R code, which is printed below:
FIGURE 1.1: A simulation of Brownian motion for 100 steps:
If we were to do this by hand, we would have to open R, paste the code into the R console to draw the plot, save it as a PDF file, and insert it into a
document with \
includegraphics{}. This is both tedious for the author and difficult to maintain — supposing we want to change the random seed in
set.seed(), increase the number of steps, or use a scatterplot instead of a line graph, we will have to update both the source code and the output. In practice, the computing and analysis can be far more complicated than the toy example in
Figure 1.1, and more manual work will be required accordingly.
The spirit of dynamic documents may best be described by the philosophy of the ESS project (Rossini et al., 2004) for the S language:
The source code is real.
Philosophy for using ESS[S]
Since the output can be produced by the source code, we can maintain the source code only. However, in most cases, the direct output from the source code alone does not constitute a report that is readable for a human. That is why we need the literate programming paradigm. In this paradigm, an author has two tasks:
1. write program code to do computing, and
2. write narratives to explain what is being done by the program code
The traditional approach to doing the second task is to write comments for the code, but comments are often limited in terms of expressing the full thoughts of the authors. Normally we write our ideas in a paper or a report instead of hundreds of lines of code comments.
Let us change our traditional attitude to the construction of programs: Instead of imagining that our main task is to instruct a computer what to do, let us concentrate rather on explaining to humans what we want the computer to do.
Donald E. Knuth
Literate Programming, 1984
Technically, literate programming involves three steps:
1. parse the source document and separate code from narratives
2. execute source code and return results
3. mix results from the source code with the original narratives
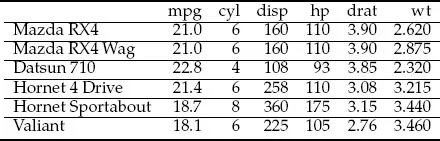
These steps can be implemented in software packages, so the authors do not need to take care of these technical details. Instead, we only control what the output should look like. There are many details that we can tune for a report (especially for reports related to data analysis), although the idea of literate programming seems to be simple. For example, data reports often include tables, and Table 1.1 is a table generated from the R code below using the kable() function in knitr:
Think how easy it is to maintain two lines of R code compared to maintaining many lines of messy
code!
Generating reports dynamically by integrating computer code with narratives is not only easier, but also closely related to reproducible research, which we will discuss in the next chapter.
TABLE 1.1 A subset of the mtcars dataset: the first 6 rows and 6 columns.
![]()
2
Reproducible Research
Results from scientific research have to be reproducible to be trustworthy. We do not want a finding to be merely due to an isolated occurrence, e.g., only one specific laboratory researcher can produce the results on one specific day, and nobody else can produce the same results under the same conditions.
Reproducible research (RR) is one possible by-product of dynamic documents, but dynamic documents do not absolutely guarantee RR. Because there is usually no human intervention when we generate a report dynamically, it is likely to be reproducible since it is relatively easy to prepare the same software and hardware environment, which is everything we need to reproduce the results. However, the meaning of reproducibility can be beyond reproducing one specific result or one particular report. As a trivial example, one might have done a Monte Carlo simulation with a certain random seed and got a good estimate of a parameter, but the result was actually due to a “lucky” random seed. Although we can strictly reproduce the estimate, it is not actually repr...