![]()
Part I
The architecture of architecture
Architects serve society by taking charge of the built environment and working to promote a better shared future for those who occupy it. Our buildings, landscapes, and cities; our furniture, teapots, and light fixtures are all targets of this attention; and architects everywhere share a caring and ambitious approach to how their work impacts our way of life. Beyond this simple set of value statements, however, architecture is a very complex pursuit and there are many dimensions to what the architect does. There are ideals and realities, form and function, opportunities and constraints, cultural expectations and social norms. There are poetic aspirations and there are ethical conflicts. An introduction to architecture must address those complex factors to shape an authentic idea of what architects do, for those architectural foundations are necessary to provide the basics on which to build broad and deep understandings. Alternatively, and especially at formative levels of learning, overly simplified notions of architecture inevitably lead to frustration and disillusionment. The three chapters of Part I thus explore the context in which architecture operates, the conversation that shapes how architecture is defined, and the forms of inquiry that architects pursue in design, research, planning, and education.
Chapter 1: Architecture after the Machine Age
Postindustrial architecture is a new context for the built environment and as the old industrial settings merge with the new, the profession of architecture is at a crossroads. What do architects say about this? What does the social science of professionalism say about this? What distributions are impacting employment in architecture? What proportion of architects are involved with which aspects of the work? How do architects create value?
Chapter 2: Architecture as a social construct
Viewed as an activity and an institution, architecture is a constructed product of discourse and critique. Such constructs are placed by Popper in World Three (our shared world of discourse and critique) and differentiated from World One (the world external to human perception) and World Two (the internal world of personal beliefs, values, and feelings). This line of thought extends back from Popper to Penrose, Escher, Kant, Plato, and others. Controversy in the history of Paris architecture is given as a case in point.
Chapter 3: Domains and agents of architecture
The four inquiry domains and the four actor agents are set into a dynamic. That inquiry dynamic is propelled by critique and discourse . . . necessitating vital interaction and critical exchange among the agents. Design and research are discussed as the inquiries of essential transformation. Strategy and scholarship are overviewed as the inquiries of connective configurations.
![]()
1
Architecture after the Machine Age
Ludwig Mies van der Rohe (1960), “Where Do We Go From Here?” Acceptance speech for Gold Medal of the American Institute of Architects
Architecture and the three eras of production
Ludwig Mies van der Rohe (1886–1969), who is generally referred to as “Mies,” was a master architect on par with his two most famous contemporaries, “Wright” and “Corbu,” namely Frank Lloyd Wright and Le Corbusier (the pseudonym of Charles-Édouard Jeanneret-Gris). Mies’ quote here was made during a period of time after World War II, as the world gradually transitioned from the industrial-machine era and into those “new forces” of progress pointing toward “a new architecture” that would come to serve what we now call the “information society.” To quote Mies again, he proclaimed as early as 1923 that “[b]uilding art is the spatially apprehended will of the epoch,” thus depicting architecture as both a response to past history and as an agent of momentous future change. This transition is crucial to understanding what architects are doing today with those “new tools and new materials.”
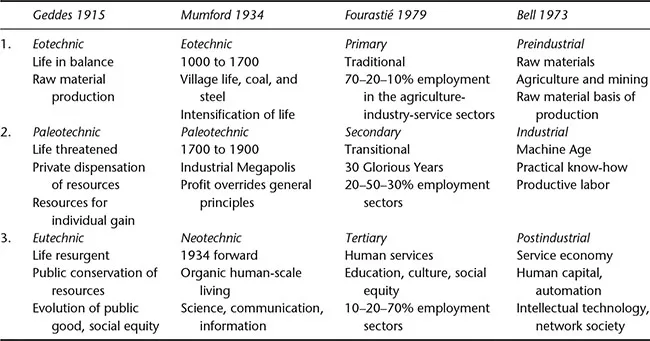
There is of course a timeless quality that characterizes all the enduring works of architecture, regardless of when those works were designed or what level of technology they employ. The production of a new project, however, is always tied to the current best means of imagination, construction, and function in use. So, while our appreciation of great architecture is a lasting treasure, our anticipation of new designs will always follow on current developments. In that light, Mies’ prediction of change aligns with three historical phases in society’s means of commerce and value production. Patrick Geddes and Lewis Mumford (see Sidebar 1.1) labeled these transitions using archeological terminology to indicate their geological scale significance: the “eotechnic” preindustrial, “paleotechnic” industrial, and “neotechnic” postindustrial ages. Other authors have seen the same patterns and articulated them in different ways (Table 1.1). In plain language these epochs all relate to the dominance of manufacturing from about 1750 to 1950 as the paleotechnic age begun during the Industrial Revolution. Eotechnic time describes preindustrial dominance of agriculture and mining before the Industrial Revolution. Our present postindustrial age and Mies’ emerging “new architecture” represent the will of a new epoch where the primary means of production and progress have shifted to a neotechnic service economy and information society. This third age is what Mies is calling upon as the urge for a new architecture.
Table 1.1 The three eras of production as themed by four authors
Sidebar 1.1 Patrick Geddes, Lewis Mumford, and D’Arcy Wentworth Thompson.
Patrick Geddes (b. 1854 d. 1932) is widely regarded as the pioneer of town planning and the first urban ecologist. Trained as a biologist under Thomas Henry Huxley, Geddes began his planning focus in the 1880s. Starting with his hometown Edinburgh, Scotland, his work included urban-scale projects in India, Mexico, Palestine, and France. His Cities in Evolution book was published in 1915 as an evolutionary framework for planning around the natural development of a city’s life based on the environment and the public. Geddes’ framework broke with the typical top-down design based on simplistic efficiency and economy. Notably, Geddes was a colleague of D’Arcy Wentworth Thompson (b. 1860 d. 1948), whose On Growth and Form is still the seminal book on “morphogenesis,” the natural shaping of form. Both authors knew Charles Darwin, who wrote the preface for one of Thompson’s early books. Thompson’s direct influence on Geddes is not documented but there are strong parallels in their work. Further, though Growth and Form was published in 1917 just after Cities in Evolution, Thompson’s book was actually developed years earlier during his time spent with Geddes, perhaps as early as 1889 and no later than 1911.
Geddes was also a strong father-figure influence on the younger American writer, Lewis Mumford, whose 1961 Cities in History would later have a correspondingly profound influence on planning in the United States. Letters chronicling Geddes and Mumford’s intellectual partnership are collected in a book by Frank Novak. Mumford was the author of some 30 books spanning architecture, literature, philosophy, history, culture, and biography. His 30 years of acquaintance with Frank Lloyd Wright are also collected in a book of 150 letters (Wojtowicz and Pfieffer, 2001). Mumford’s own 1934 book Technics and Civilization is particularly relevant here. His argument for organic responses to nature in favor of highly mechanized society are also captured in his 1970 critique of the New York Authority’s World Trade Center, as its construction was in initial phases: “a characteristic example of the purposeless giantism and technological exhibitionism that are now eviscerating the living tissue of every great city.”
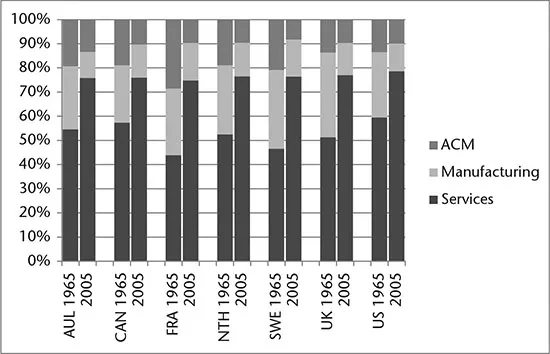
Correspondingly, primary modes of labor and commerce across history have shifted from working the land by agriculture and mining; then, after the Industrial Revolution, to rote machine-operating labor; and now to the knowledge worker (see Sidebar 1.2). As Mies points out, each age has a different role for architecture. Figure 1.1 and Sidebar 1.2 illustrate the dramatic swing in employment across some highly developed countries for the 50 years between 1965 and 2015. Along the way, of course, we did not quit mining and farming at the start of the Industrial Revolution; nor did we shut down all the factories at the beginning of the neotechnic information age. These transitions from one age to the next are also not uniform and universal across the world; they occur at different rates and to different degrees of impact. Equally important, there is no privilege or status among and between the sectors of production and all three continue to be necessary to human prosperity. Table 1.3 shows the impacts these giant shifts have on how architecture serves society. If architects understand these forces of change, they can respond in proactive ways that enable them to engage with and promote progress; otherwise the profession can only react to disruption as it happens. Proactive roles allow for significant contributions toward an intentional future, whereas passive attitudes of reacting to change after it happens might exclude architects from relevant work.
Sidebar 1.2 Growth of service sector employment for 49 countries: 1965 to 2015
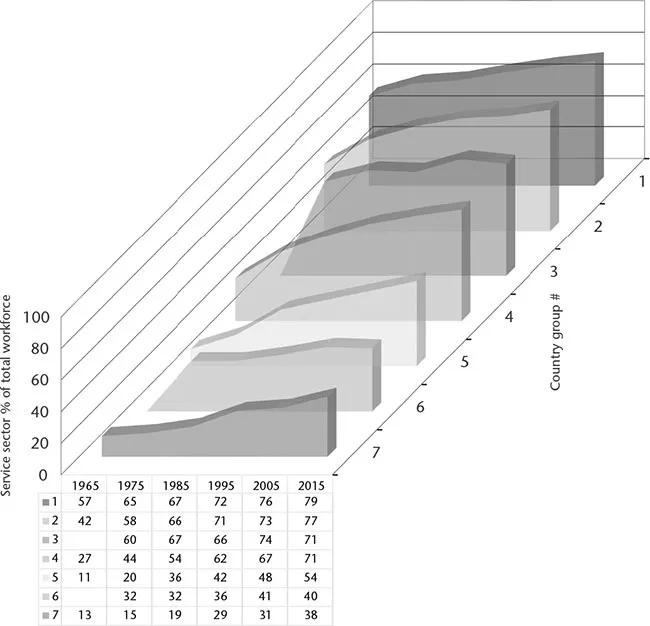
Figure 1.2 expands on Figure 1.1 and represents 49 of the world’s largest economies organized into seven groups by their Gross Domestic Product (GDP), market similarity, and geographic location. All together, these countries comprise about 90% of both the world’s total GDP and its entire population. Groups were set up to illustrate the worldwide postindustrial transition to a service-based workforce in the Information Age. One-third of the 49 individual countries in this sample are approaching a service-sector workforce employment of 80%, with most of the rest of employment still in secondary-sector manufacturing and a small dwindling amount in primary agriculture and mining. GDP for this ranked sample is adjusted to account for comparative cost of living. Political structure, predominant religions, and social context are not considered but probably have indirect influence on the groupings.
• The first set of countries includes the US and UK as the second and ninth largest economies, respectively, totaling about 30% of the world GDP economy and 9% of the global 7.3 billion people. Canada, Australia, and South Africa are also grouped here;
• The second group illustrates Scandinavia’s strong postindustrial emergence from World War II with the twenty-eighth, thirty-eighth, and forty-eighth ranked economies (the Netherlands, Sweden, and Norway, respectively). This is despite the relatively small geographic size and population of those countries: Scandinavia is about 2% of the global economy and 0.6% of the world population;
• Group 3 is predominantly Latin America with some 3% of the world economy, and 7% of the global population. Brazil is the world’s eighth largest economy with 2.5% of global population. Mexico is eleventh with 2% of the world’s people, and Argentina is twenty-seventh with 0.7% of global inhabitants;
• Next is a European block with Israel included, and this represents about 5% of the global economy, and 5% of the world’s population;
• The fifth group includes Japan, Indonesia, and South Korea, the fourth, seventh, and fourteenth ranked global economies. Collectively this group represents about 7% of world GDP and 22% of the global population;
• The sixth group includes Turkey, Saudi Arabia, and Iran as the primary members, ranking 13, 15, and 21 in GDP. This group has about 6% of the world GDP and 7% of the population;
• The final group includes China, India, and Russia as the first, third, and sixth highest GDPs. Collectively this last group produces some 30% of the world’s economy with about 45% of the global population.
GDP per capita data also reflect how far service employment has carried some countries into more prosperous information society. If the world average GDP/capita is set at 1.0, then the US and UK group are at about a multiple of 5.0 times that, as is the Scandinavian group. The Latin American group is about 0.9 while the European group comes in at 3.4. The Japan, Hong Kong, and South Korea group is at some 0.5 ratio of the worldwide average. Group Six with Turkey, Saudi Arabia, and Iran are also at 0.5 as is the seventh group dominated by China, India, and Russia.
In conclusion, countries in this sam...