![]()
1 Air cargo traffic and capacity
1.1 Air cargo traffic trends
In this chapter trends in both international and domestic air cargo traffic will be analysed, focusing on cargo tonne-kms as a traffic measure but also using tonnes carried where appropriate. Freight and express will be distinguished from mail and trends on passenger and freighter flights will be identified. The main trade routes will be examined, also moving to a country level where warranted. More detailed data at the airline level will be discussed in Chapter 4. Mention will also be made of trucking, in cases where it is used as a cheaper alternative to aircraft on an airport to airport basis.
The second section will compare trends in air cargo traffic and economic indicators, exploring correlations at the global level. This is followed by an analysis of the freight handled at airports to see how the importance of major hubs is changing, finishing up with indications of traffic flows by season, month, and day of the week. While annual traffic is the most usually reported metric, variations within a year are useful in planning schedules and airport capacity.
1.1.1 Global traffic
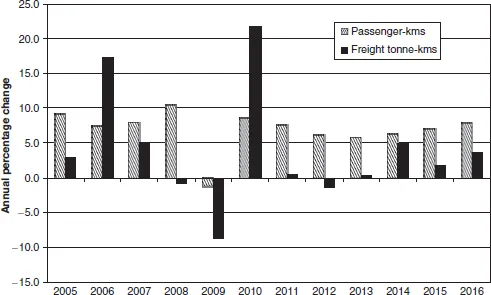
International freight traffic, excluding mail, has grown at an average rate of 5.3% a year between 1995 and 2005, at a much slower rate of 3.7% from 2005 to 2016 (Figure 1.1). The more recent period spanned the aftermath of the banking crisis and trade slump, traffic only really picking up since 2016. In the past, freight turned down before passengers and recovered first and often faster. The opposite was true over 2010 to 2016, when passengers increased strongly from 2010 to 2016. International mail traffic expanded more slowly over the 11 years to 2005 (2.2% p.a.) but faster over the next period (4.8% p.a.).
Figure 1.1 Passenger versus freight traffic trends, scheduled international services, 2005–2016
Source: ICAO and IATA
Freight tonne-kms are usually preferred to tonnes as a traffic measure for aggregate analysis since this captures both the weight and distance travelled. The trends for each are in fact very similar, since the average distance each tonne of freight was carried has remained fairly constant at between 5,100 km and 5,600 km. This reflects the preponderance of traffic carried on the long-haul trade lanes between Asia on the one hand and Europe and North America on the other.
Domestic freight traffic accounted for 16% of total world traffic in 2016, much of it carried within the US. Trends in domestic traffic were distorted by a major change in reporting traffic in the US: the United States Department of Transportation implemented new air traffic data reporting rules whereby previously reported non-scheduled freight traffic was reported as scheduled traffic from 2003 onwards. Consequently there was a discontinuity in US DOT traffic. ICAO obtains its data from member governments and thus its data contain the same change, but this will not affect the 2005 to 2016 trend in Figure 1.2.
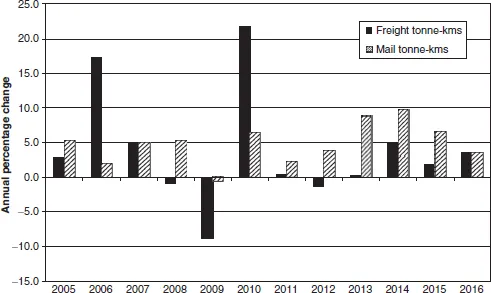
Figure 1.2 Growth rates for international freight versus mail traffic, 2005–2016
Source: ICAO and IATA WATS 2017
The above would distort the comparison of average annual growth of world ICAO freight and passenger traffic, with the reported figures showing freight to have grown by 1.5 percentage points faster than passengers. The average length of haul for domestic freight was as expected much shorter than international: around 1,100km compared to 5,100km for international in 2015.
Total world scheduled international mail RTKs declined from 68% of total cargo traffic in 1938 to 21% in 1970 and 2.5% in 2008, and 2.2% in 2016 reflecting both the rapid growth of freight and the success of the integrators whose express traffic is recorded under ‘freight’. In 2015, domestic mail accounted for 6.7% of total cargo tonne-kms. This might be surprising given the expectation that more mail would move by surface transport over the shorter domestic distances. However, the domestic data includes a large weight from the US (as mentioned above) and the integrators’ data has been reported under domestic traffic. The US integrators, especially FedEx, had a contract to carry mail within the US, and most of this would be carried by air via its Memphis hub.
Figure 1.2 compares the growth rates of mail and freight on international routes. In earlier years there was a diversion of smaller parcels to the integrators as they expanded internationally, and this traffic would be reported under freight (and express). Mail has historically not been immune to sharp downturns that have hit freight, but it has avoided years of negative growth and many of the national post offices have become more efficient and in some cases privatised. Over the period 2005 to 2016 freight has increased at an average rate of 3.4% compared to 4.4% for mail. One reason for the higher growth rate of mail may have been the greater use of post offices to deliver (and sometimes return) internet shopping items. These may have been more expensive by express.
The share of international cargo traffic carried on freighter flights has increased over the past ten years from 42.9% in 2008 to 52% in 2008 before falling back sharply in 2009 (Table 1.1).1 The sudden downturn in traffic at the end of 2008 resulted in a widespread grounding of freighter aircraft without such a removal of the capacity offered on passenger fligh...