![]()
Chapter 1
Industry Financial Performance
1.1 The Impact of the Banking Crisis, Post-2008
The banking crisis was triggered by the collapse of a major US investment bank Lehman Brothers in September 2008, although there were already signs of an impending crisis before then. This was to have far reaching consequences for the world economy, the financing of international trade, the stability of the banking and monetary system, and the world’s airlines.
The immediate effect of letting Lehman Brothers cease trading (a government bail-out was considered but rejected) was for the inter-bank lending market to dry up completely with central banks stepping in to prevent the total collapse of the banking system. Trade finance became scarce, and the loss of confidence of traders and investors led to a sharp downturn in the world economy. This was reflected first in a rapid fall in air cargo traffic with a decline in passenger numbers following. World international air cargo tonne-kms fell 0.8 per cent in 2008, and a staggering 8.8 per cent in 2009, the largest fall for at least 20 years. Passenger-km traffic was 3.3 per cent up in 2008, but fell by 1.3 per cent in 2009.
The cause of the banking crisis was firstly bank lending to investors in the property markets, mainly in the US but also in Europe. This so-called ‘sub-prime’ lending was based on a boom in house prices which the lenders assumed would continue long enough for them to be repaid and pocket their fast growing profits. The growth of this business was increasingly fuelled by lack of credit checks and loan amounts in excess of the value of the collateral (the house or apartment). Second, these loans were being packaged or securitised and sold on to other investors,1 so as to free up bank balance sheets to lend more to even worse risk borrowers. Securitisation was also applied to aircraft leasing in a more cautious and limited way, described in Chapter 11.
No single event started the collapse, but the significant change was the housing bubble bursting and prices starting to fall. This led to very large book losses for many of the large international banks that had been involved in what had been a very profitable business. Governments now decided that banks should be bailed out rather than risk an international collapse of the banking system. Central banks pumped large amounts of credit into the system, and the world economy made a short-lived recovery, with air traffic (especially air cargo) bouncing back in 2010. However, in 2011/12, the sovereign debt crisis in Europe2 and the possibility of a break up of the euro area led to a stalling of the economy and air traffic.
Airlines and other companies were moving towards fuller disclosure in their annual reports, and a major part of this was to describe the key risk factors that they face. Risk was split into various categories, including labour relations, fuel price spikes, access to airports and infrastructure, and disasters such as volcanic eruptions and terrorist attacks. The financial risks deal with fuel prices, interest rates and currency movements. Hedging positions now needed to be identified, and the degree to which each risk is reduced and the cost of these identified. Airline activity in this area is described in Chapter 9.
Airlines need to borrow from banks and also invest their surplus funds with them. Borrowing often involves putting up cash deposits as security, or lodging a letter of guarantee from a bank. This means that a bank default, and the subsequent inability to repay the deposit or pledge, would result in a loss for the airline. If a counter-party to a hedge position ceased trading the airline may have to sell a position at a loss (in addition to losing security deposits). The same would apply to relations with a leasing company. So, increasingly, airlines need to take into account the credit rating of the bank or financial institution it is doing business with (whereas previously it was assumed that the risk of their bankruptcy was very low). The ratings agencies and their method of grading banks and other companies (including) airlines is covered in Chapter 4. Airlines are thus starting to identify the amounts that they have at risk with each institution and publish this information in their annual report.
The banks that the airlines deal with are discussed in more detail in Chapter 5. In June 2012, Moody’s downgraded many of the major international banks by between one to three ‘notches’ or levels on their scale (see Chapter 4 for the scale and Standard & Poor’s equivalents). Thus Credit Agricole, an active bank in lending to airlines, was downgraded on its long-term debt from Aa3 to A2 (two notches), Barclays from A1 to A3, majority UK government owned Royal Bank of Scotland from A3 to Baa1 (only one notch). HSBC remained one of the highest rated due to its smaller exposure to the property market and sovereign debt, but dropped from Aa2 to Aa3, only one notch.
Some airlines are now required by their hedging committees to restrict fuel hedging counter-parties to Standard & Poor’s A+ grade or better. This is equivalent to Moody’s A1 or higher. On this basis, only HSBC of the large banks mentioned above would qualify. This credit risk was quantified by Emirates Airlines in its 2011/12 annual report, where it reported that AED489m of its cash and cash equivalents were placed with banks that had a credit rating (Standard & Poor’s) of AA to AA+, AED13,872m with A to A+ rated banks and AED886m with those rated lower than A (but presumably above speculative grade).
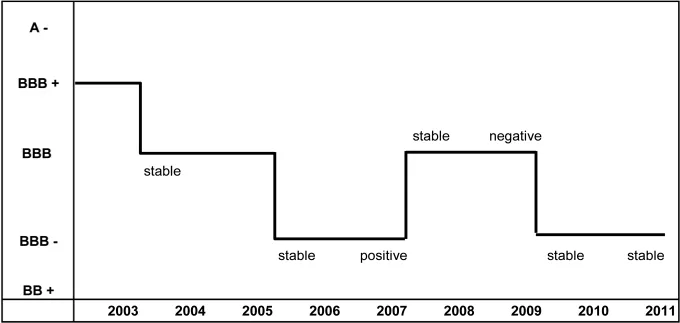
Figure 1.1 Lufthansa Group: Long-term debt credit ratings (Standard & Poor’s)
Source: Lufthansa Group Annual Report, 2007 and 2011.
Of course the airlines’ ratings also slipped over this period, one of the best risk airlines (that has a rating), Qantas having the prospect of being downgraded in 2012. This meant that their cost of borrowing would go up, but at least funds were still available from banks seeking higher premium business to offset their large losses. Figure 1.1 shows how one of the major ratings agencies changed its view on the Lufthansa Group’s long-term debt leading up to and after the financial crisis.
Another aspect of the banking crisis related to the companies that lease almost 40 per cent of the world’s commercial fleet, the operating lessors. Many of these companies were owned by banks and insurance companies. In the past this gave them access to funds at close to the excellent credit ratings enjoyed by their parent companies. The banking crisis turned this upside down, at best resulting in the large funding that was required to invest in aircraft becoming much more expensive; at worst, their parents were threatened by bankruptcy. One of the big two lessors, the International Lease Finance Corporation, was wholly owned by American International Group, one of the largest insurance companies in the US and Asia (its position in aircraft leasing is discussed in Chapter 5). This company had established a capital markets subsidiary (AIG Financial Products), unrestricted by the bank reserve requirements. It was this business that rapidly started acquiring the so-called ‘super-senior’ debt in sub-prime mortgage securitisations (these mostly related to houses and commercial property, but aircraft leases were also used, described further in Chapter 11), as well as issuing Credit Derivatives Swaps (CDSs), thus insuring the investment banks against loss.3
AIG was a very large company but by summer 2007 its subsidiary had amassed around US$560bn of super-senior debt,4 with huge potential claims against its credit default swaps. As Lehman Brothers began to collapse, an avalanche of these claims hit AIG and it had not ring fenced sufficient cash to meet them. In the event the US government bailed out the AIG parent by taking a 79.9 per cent stake. By June 2012 it still had around 70 per cent of the equity, although it had intended to sell off the ILFC subsidiary (which had continued trading throughout the crisis) through an IPO towards the end of 2011.5
Thus it was inevitable that an international industry which invested very large sums of capital would be affected by a major crisis of financial intermediaries. These channelled the funds to the companies that needed them and airlines might have found themselves unable to finance the US$70bn or so of annual aircraft orders between 2008 and 2012. In the event, governments intervened, fearing that if more ‘Lehmans’ went under financial melt-down was possible. The US government stepped in to save AIG as described above, avoiding a ‘fire’ sale of the 174 aircraft that ILFC had at the end of 2008. Governments also prevented the bankruptcy through purchase of equity of some very large international banks such as the Royal Bank of Scotland and HBOS in the UK. Sovereign wealth funds in Asia and the Middle East bailed out other banks such as UBS of Switzerland and CitiGroup in the US. All these banks were large lenders to airlines. Finally, government-backed export credit agencies in the US and Europe stepped up guarantees on bank lending for aircraft, helping bridge the gap between the funds needed and available for delivery in 2009, 2010 and 2011.
1.2 World Airline Financial Results
The airline industry has over the years been buffeted by both economic cycles and threats from war, terrorism and epidemics. Following seven years of good profitability that stemmed from a relatively long world economic upswing between 1994 and 2000, it suffered a severe setback in the 2000s with the post ‘year 2000’ downturn and the aftermath of 9/11. Cumulative net losses of the world’s scheduled airlines amounted to US$20.3bn between 1990 and 1993, but this was followed by almost $40bn in net profits between 1995 and 2000. Again, a gradual recovery between 2003 and 2007 returned reasonable good profits to many world airlines and restored their balance sheets to more acceptable levels. The very sharp 2008/9 downturn was caused by the banking and world liquidity crisis, but the recovery was short-lived because of the continued need for banks and governments to improve their financial situation to the detriment of consumers. This highlights the cyclical nature of the industry, and the need to treat with caution comments after the Gulf War recession and 9/11 about the continued ability of the industry to finance expansion.
Since the end of the early 1990s recession, the airlines’ balance sheets have been considerably strengthened, even allowing for the replacement of large numbers of noisier aircraft that did not meet current Chapter 3 standards. ICAO figures showed the debt/equity ratio for the world’s scheduled airlines declining from a high of 2.90:1 at the end of 1993 to 1.42:1 at the end of 1999. This had deteriorated to 2.46 in 2003, before improving somewhat to 2.41 in 2004. However, the ratio worsened again in 2005, the last figure published by ICAO.6 Between 2005 and 2012, it is likely that gearing or leverage for the airlines as a whole has improved, especially if the more comprehensive net debt/equity ratio is used which offsets total debt by liquid assets available (see Chapter 3 for more on the various airline financial ratios). Boeing proposes two reasons for this recent reduction in financial leverage: first they are outsourcing the debt by leasing many of their aircraft rather than buying them; and second, they are reducing their borrowing by making larger cash down payments.7 However, the Bloomberg gearing given in Pearce (2012) shows a slightly different picture: a low point was achieved in 2007, with a sharp increase between 2007 and 2009 to a higher level than in 2005.
Clouds appeared on the horizon in 1999, with the price of jet fuel jumping from 40 cents per US gallon a barrel to 75 cents in January 2000. This led to a drop in operating profits, although net profits were maintained largely due to the sale of aircraft and non-core investments such as holdings in IT and communications companies. The dollar price of fuel in 2001 was still well below its high in 1981. At that time fuel expenses rose to just under 30 per cent of total airline operating expenses. In 2000, they were still only 12 per cent of the total, even after recent sharp increases. This has been helped by substantial advances in fuel efficiency. For example, British Airways has reduced its average fuel consumption in terms of grams per revenue tonne-km from around 440 in 1990/91 to 345 in 1999/2000 (or by an average of 2.6 per cent a year), and more than met its target of 306 gm by 2010.
As stated above, the fuel price started increasing alarmingly in early 1999; a further advance occurred at the end of summer 2000 to a high of 107 cents, before the price fell back to around 75 cents by the end of 2000.8 The next period of instability was in 2004, when prices ranged from a low of 92 to a high of 157 cents per US gallon. In the following year the range ratcheted up to 119–223 cents, and the 2005 high of 223 cents was again reached in August 2006. This was repeated in 2008 when high demand and instability pushed the jet fuel price to a new high of just over US$4 per US gallon (on the Rotterdam spot market) almost double the 2004/05 high.
Figure 1.2 ICAO scheduled airl...