![]()
CHAPTER 1
Understanding the Road Safety Performance of OECD Countries
Kavi Bhalla
Assistant Professor, International Health, Johns Hopkins School of Public Health, Baltimore, MD, USA
Dinesh Mohan
Volvo Chair Professor Emeritus, Transportation Research & Injury Prevention Programme, Indian Institute of Technology Delhi, Hauz Khas, New Delhi, India
CONTENTS
1.1 Overview
1.2 Economic determinism: road safety performance as a developmental outcome
1.3 Risk substitution: car occupants are at much lower risk than pedestrians
1.4 Political action: the role of institutions and interventions
1.5 Conclusion: what does this all mean for developing countries?
ABSTRACT
The road safety performance of economically developed OECD countries over the last century shows a remarkable and consistent pattern. In most of these countries, road traffic deaths were rising until the 1960s but have declined steadily since then. Understanding the road safety history of OECD countries can provide useful insights to road safety professionals in low-and middle-income countries (LMICs) to help them better manage safety in their transportation systems. This chapter examines the trends in performance of OECD countries through three perspectives. The first considers the rising and falling trends in road traffic deaths as a natural developmental process (“economic determinism”). In this perspective, road traffic injuries increase initially as a society motorizes but injuries begin to decline after the society reaches a certain developmental threshold, after which it begins to address its health and environmental issues. The second perspective critiques this position by illustrating that the rising and falling trends can partly be explained by the shift in risk that occurs when motorization is primarily through increasing caruse. As the use of cars increases, the risk to pedestrians initially increases. However, eventually most pedestrians become car users and further motorization reduces the number of pedestrians and hence their exposure to road traffic injuries. In the final perspective, we look at the issue through the lens of a political process. We reassess the statistical data to show that the late 1960s were a special moment in history when the OECD countries that were at substantially different income levels acted together to regulate transport risk by establishing and funding national road safety agencies. Over the following decades, these institutions were able to implement large-scale national road safety programs that have had a remarkable effect on reducing the road death toll. The main implication of this perspective for LMICs is that countries do not need to wait to be richer to address road safety. Instead, they should act now to establish national institutions with the mandate and resources to regulate and manage road safety in their transportation system.
Key Words: Road Safety Performance; OECD countries; Kuznets hypothesis
1.1 OVERVIEW
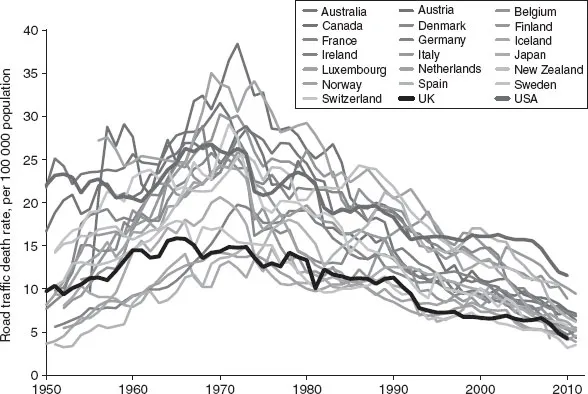
The history of the road safety performance of economically developed OECD countries is remarkable. As illustrated in Figure 1.1, road traffic death rates in these countries were rising until the late 1960s. However, road traffic death rates in these countries have been declining steadily ever since. Although the use of motor vehicles grew steadily over the 20th century, OECD countries were able to reverse the increasing trend in road traffic fatalities and have successfully maintained steadily improving road safety performance for over five decades. In sharp contrast, road traffic death rates in most low- and middle-income countries (LMICs) are still rising. Most researchers attribute this increase to the rapid and unmanaged growth in motor vehicle fleets of LMICs. Thus, Figure 1.1 is intriguing because it raises questions that are important for road safety researchers and practitioners in LMICs. How did OECD countries reverse the rising trend in road traffic deaths despite increasing motorization? How did they manage to sustain improvements in road safety performance over such a long period?
Figure 1.1 Road traffic deaths rates in OECD countries were rising prior to the 1960s but have declined steadily since then.
Source: Author’s analysis of national death registration data. Analysis is restricted to 21 OECD countries with high quality death registration data.
Three-year moving average of road traffic deaths rates has been used for countries with fewer than 5 million people.
Let us start by taking a closer look at a few of the features of the time trajectories in Figure 1.1. First, consider the history of the road safety performance of the US. Road traffic deaths rose sharply in the US during the early 1960s. This was a period of dramatic growth of the US Interstate Highway System, which was constructed after passage of the Federal-Aid Highway Act in 1956. The act authorized 42,000 miles of highway construction, of which about half was built by 1965 (WC 2015). At the same time, the vehicle fleet in the US was shifting towards bigger and faster cars, which had the ability to travel at high speeds on the newly developing highway infrastructure. The year 1973 saw the single largest drop in road traffic deaths ever in the history of road safety in the US. This was the year of the oil crisis, when the Organization of Arab Petroleum Exporting Countries (OAPEC) declared an oil embargo that caused the oil prices to quadruple, leading to nationwide fuel shortage. The US Congress responded to the oil crisis by setting a lower national highway speed limit of 55 miles per hour because cars burn fuel less efficiently at higher speeds. Reducing speeds are an effective road safety intervention (Richter et al 2004), and the lowered speed limits likely contributed substantially to the decline in injuries in that year (Friedman et al 2009). Ultimately, however, the lowered speed limits were difficult to sustain and many US states raised their speed limits over the years that followed. The increase in fuel prices also had the direct effect of reducing driving and hence exposure to crashes. More generally, the economy and road traffic injury trends are closely related because the economy directly affects the amount of vehicle use. Thus the rise and fall pattern in the US road safety performance broadly tracks the economic boom- and bust-cycles, with sharp decreases corresponding to the 1980 and 2008 recessions.
In addition to the influence of large economic, social, and political forces, there were important actions specific to road safety that affected national road safety performance. In 1966, the US congress passed the Motor Vehicle Act, which led to the establishment of the National Highway Safety Board (later the National Highway Traffic Safety Agency, NHTSA) at around the time when death rates in the US peaked. Over the decades that followed, NHTSA worked with other government institutions, such as the Federal Highway Administration, to regulate the design of vehicles, highways, and the safe use of roads. We will return to a discussion of the role of national safety agencies later in this chapter.
Next, let us compare the road safety performance of the UK and the US over the last century. The overarching shape of the US and UK curves in Figure 1.1 is similar, with both countries showing a broadly synchronous rise through the 1960s followed by a long-run decline in death rates. However, it is notable that the US curve runs higher than the UK curve over the entire duration. Thus the US has always had a road traffic death rate that exceeds the UK by an approximately fixed amount. This suggests that there may be structural differences between the two nations that have remained broadly fixed for a long time. Perhaps the most notable difference is the way in which transport is configured in the two countries. Travel in the US is more likely to involve longer trips, the use of a high-speed road infrastructure and private motor vehicles, as opposed to the UK, where trips are shorter and the use of inter-city rail or urban mass transit systems is common. Thus, the average annual distance driven per capita in the US is almost twice that in the UK (Luoma and Sivak 2013). This is partly due to the larger landmass of the US but also due to policy choices that have prioritized highway travel and sprawling cities over the last century.
The preceding discussion barely touches on specific road safety interventions, such as speed control, airbags, helmets, and seatbelts, which make up the day-to-day work of most road safety professionals. These interventions are obviously important to road safety. However, when thinking on the broad scale of the safety of large populations over decades, it is also important to think about the political, institutional, and structural relationships that allow road safety interventions to be deployed on a wide scale and sustained for a long time. These relationships are the focus of this chapter.
We now extend this discussion to beyond the US and UK, and consider what the history of road safety in OECD countries can teach us about what lies ahead for LMICs. The rest of this chapter explores the trends of road traffic death rates in OECD countries through three perspectives:
1. Economic determinism: This perspective describes the rise and fall of road traffic death rates in OECD countries as a process determined by economic development. In this view countries invest in road safety once they have reached a certain developmental threshold.
2. Risk substitution: This perspective illustrates that a rise and fall of road traffic death rates should be expected in a society that is motorizing primarily through car ownership. In this view, road deaths begin to decline when most pedestrians become car users, lowering the aggregate societal exposure to road traffic injuries.
3. Political shift in the road safety paradigm: The history of road safety in OECD countries shows that the late 1960s were a special moment in history when OECD countries that were at substantially different income levels acted together to regulate transport risk by establishing and funding national road safety agencies.
1.2 ECONOMIC DETERMINISM: ROAD SAFETY PERFORMANCE AS A DEVELOPMENTAL OUTCOME
Many researchers have studied statistical data of the type shown in Figure 1.1 and attempted to explain the rise and fall trend in road traffic injury rates (Jacobs and Cuttings 1986; Soderlund and Zwi 1995; Van Beeck et al 2000; Garg and Hyder 2005; Kopits and Cropper 2005; Bishai et al 2005; Paulozzi et al 2007; McManus 2007; Law et al 2009; Grimm and Treibich 2012; Nishitateno and Burke 2014). Some of these studies are cross-sectional studies (i.e. single year data from multiple regions) (Jacobs and Cuttings 1986; Soderlund and Zwi 1995; Van Beeck et al 2000; Garg and Hyder 2005; Paulozzi et al 2007), while others use panel data (i.e. data for multiple years from multiple regions) (Kopits and Cropper 2005; Bishai et al 2005; McManus 2007; Law et al 2009; Grimm and Treibich 2012; Nishitateno and Burke 2014). Some are cross-national studies (Jacobs and Cuttings 1986; Soderlund and Zwi 1995; Van Beeck et al 2000; Kopits and Cropper 2005; Bishai et al 2005; Paulozzi et al 2007; McManus 2007; Law et al 2009; Burke 2014), while others focus on sub-national regions of a single country (Garg and Hyder 2005; Grimm and Treibich 2012). Overwhelmingly these studies have tended to analyze road traffic death rates as a function of income growth. Typically, this involves reassessing the data in Figure 1.1 using per capita income as the independent variable (e.g. see Figure 1.2), demonstrating that injuries initially rise with income and then fall, and measuring the parameters of statistical (regression) models that fit this data. This rise-and-fall represents an inverted U-shaped curve, which is the broad pattern of Figure 1.2, and is referred to as the “Kuznets curve”. Thus, all of these studies find that there is a general relationship between income growth and road traffic injury such that when countries are poor they experience rising injuries with increasing income; and when countries are rich they experience declines with increasing income. The underlying logic of this hypothesis is that when countries are poor, growth in income is closely tied to increase in motorization, which leads to higher exposure to road traffic injuries. At this stage it is assumed that countries are too poor to invest in harm reduction. However, after a certain level of economic development has been achieved, countries begin to invest in road safety programs and reduce their road traffic injury rates.
There is a problem with this argument that has not received substantial attention in road safety literature. When the data is presented as shown in Figure 1.2 with income as the independent variable (x-axis), it encourages thinking about national road safety performance as a process that is an outc...