chapter one
A different approach
This chapter reviews some important clue-generating concepts that do not require a complicated statistical design or analysis. The methods presented here can provide valuable clue information and scrutiny.
The following methods will be summarized and discussed plainly so that you can see and believe that the applications are useful in solving difficult manufacturing problems. These include the following:
Using visual observations to make comparisons.
Generating concept sketches to help focus and analyze conditions, which can help to identify and describe the problem conditions.
Comparing and scrutinizing one piece to another (a twin set) or one group twin set to another can give valuable about part or group differences may be distinct or unusual.
Using tables to link one part to another.
Using tables for comparison of one group to another group or differences found within a group.
Ranking the data (classify data by magnitude).
Using simple analysis steps that can lead to valuable clues.
1.1 Visual observation
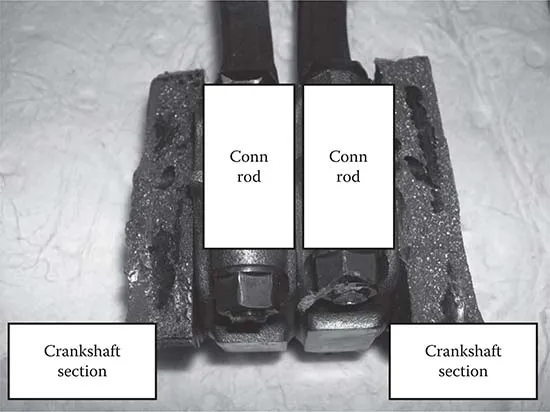
What is a visual detrimental condition? It is the observation of an adverse property that has been generated and recognized as a clue. Once recognized, the condition can be described to define a failure. Consider the following visual example that indicates clear recognition of an adverse effect. It is the remains of a piston crankshaft assembly that has failed (cracked) in the field. The photograph clearly shows that there was a significant failure (Figure 1.1).
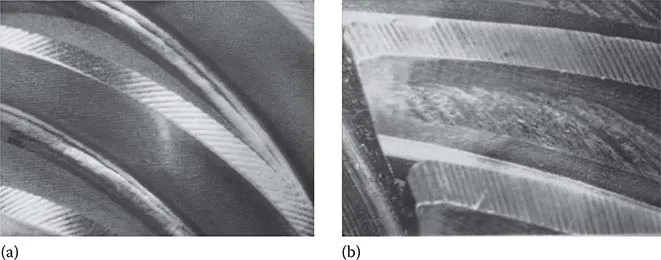
Another type of visual representation is that which might be used at a research facility to identify the incidence or occurrence of wear (scoring) on a gear tooth. This type of inspection and test is, and can be, used to determine the development of scoring on different gears to prevent early failure and to give longer life. It might also be used to determine which of the base metal chemistry available will provide long life, or which gear tooth involute (shape of the gear tooth) measurement would be most appropriate. (The involutes are a measurable characteristic of the gear tooth profile.) These visual controls and recognized measurement can be created to establish visual evaluation and rating systems. Observe the dissimilarities in Figure 1.2.
Figure 1.1 Broken crankshaft with connecting rods.
This type of visual observation and comparison can also be used in the diagnosis of wear problems experienced by the gear teeth. While working in a large midwest gear center, I evaluated both gear pitting and scoring
Figure 1.2 (a) New and (b) damaged gear teeth.
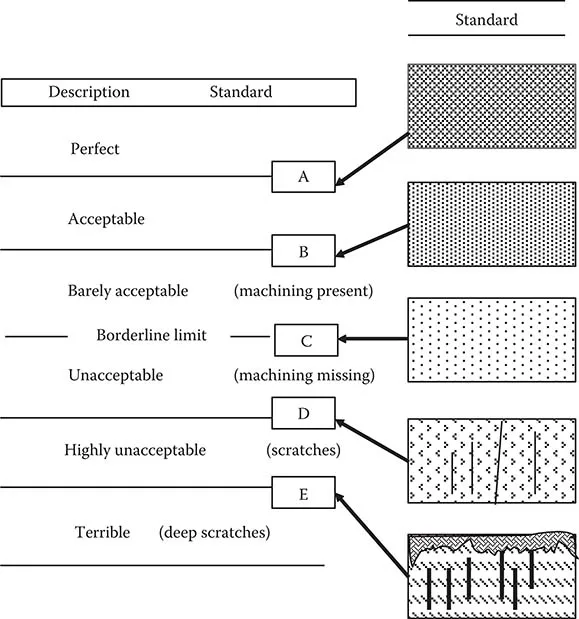
Figure 1.3 Gear tooth scoring visual guide. Note: Standard to be established via customer input gear tooth face to exhibit no scoring.
on newly designed gears to evaluate the design and metal used in the proposed gears. Pitting is the creation of a void (pothole) in the wear portion of the gear tooth. Scoring is the condition of scratching and polishing of the gear tooth that erodes the original tooth surface. Figure 1.3 shows the incidence of scoring as established by testing at the gear test facility. The crosshatch pattern at the top is indicative of a brand new smoothly machined polished surface.
During testing, the leading edge of the tooth can deteriorate as scratching and wear increases as shown from the top of the illustration to the bottom. If an observation results in a surface with less wear than the borderline condition "C," then it is acceptable. If mars and scratches are more than condition "C" and approaching condition "E," the condition is rated as unacceptable.
You can create this type of comparison chart by establishing samples to indicate where borderline acceptable, excellent, and terrible conditions are present. Then use your judgment along with the visual aid to establish boundaries or to compare the differences between two groups of five, as will be explained later.
1.2 Concept sketches
A concept sketch is any sketch, chart, visualization, or depiction that summarizes the thoughts of the investigator as to what is associated with the problem at hand. It does not have to be an exquisite sketch to be effective. It need only address the operating conditions.
These sketches help establish the problem. They can be used to generate specific clues as to the conditions that are different between two or more twins that are being compared, or they may actually point to the failure mode that is being investigated.
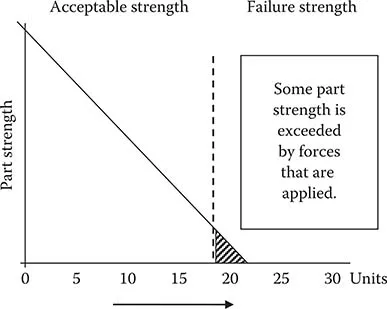
For example, a basic sketch may illustrate how a force might exceed the part strength at a particular level. Since part durability is affected by forces and allows failures, once the part strength has been exceeded, failures occur (Figure 1.4).
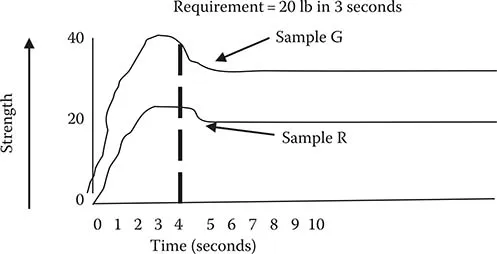
Since the force applied may be greater than the part strength, the part is subject to failure. This is illustrated in Figure 1.4 when the component strength is exceeded by the force used. Concept sketches may show how two groups tested for pull strengths differ (Figure 1.5), or they may indicate those item(s) that can cause a failure as shown by the following comparisons.
Figure 1.4 Force versus strength illustration.
Figure 1.5 Comparison of hot box cure strengths.
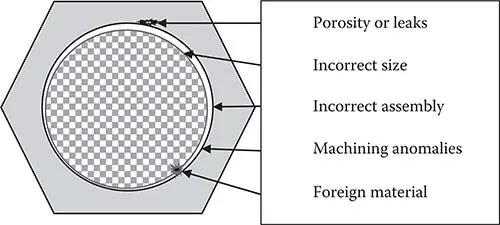
Illustrations and visualizations can provide useful clues when depicted on a concept sketch. The next figure depicts the conditions that may have contributed to a V-6 engine fuel line leak failure. Note that more than one adverse condition can affect the quality of a secure seal whenever an assembly is manufactured. In this case there may be contributors caused by casting defects, imperfections, damaged components, inadequate materials, machining difficulties, and foreign materials.
Causes of fuel line assembly failure may be sketched to show the potential causal conditions. It may be due to foreign material, faults in machining and assembly, incorrect size, or cracks or porosity. The sketch need not point to the root cause of the failure condition but to factors that should be considered.
So concept sketches can be an important tool in generating clues or providing insights into what is causing a problem condition, as shown in Figures 1.6 and 1.7. This is an extremely effective tool in providing insight that becomes easier to use and more efficient with every application. It has provided me many opportunities for success in problem solving.
Figure 1.6 Potential leaking fuel pipe causes.
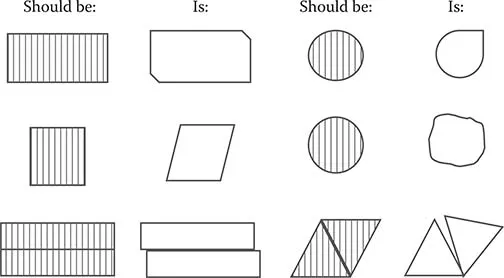
Figure 1.7 Visual comparisons of good and bad samples.
1.3 Clue uniqueness
There are different clue oddities that are associated with data collection efforts and the inspections that are to be conducted to allow twin set and group comparisons.
The first of these eccentricities is observed by determining if the parts are similar so that a particular characteristic can be compared. It is necessary to determine if there are any differences between individual parts. (One might ask if this is the correct part that is supposed to fit in the assembly or if this part is damaged in some way. What is different? This is an important question.)
A second idiosyncrasy occurs when seemingly similar and identical parts vary in their ratable characteristics that can be determined with the use of calibrated instruments. Most individual differences may be due to shrinkage, machining, damage, or other peripheral incidents. These piece differences are exhibited when one part is much different from another. (Individual differences can be determined with the use of gauge blocks, micrometers, rulers, or other more sophisticated measuring instruments. They could be caused by bad machine bearings or loose tool holders.)
The third of these measurable oddities is the difference in the artistic characteristics of the individual components being measured. Individual aesthetic differences are present when there is a major difference exhibited by different pieces in a sample. Color charts are commonly used to provide paint and fabric color specimens to act as a standard.
These aesthetic qualities can be rated similarly to the physical characteristics to glean comparisons. (Perceived quality, color, noise, shading, smoothness, roughness, or other artistic characteristics can be rated and measured for comparisons and decision making.)
A fourth peculiarity is the relationship contained in a group. Group differences are exhibited when two groups are different from each other. Can all the parts in a group be considered the same? Does every part in one group differ from every part in a similar but different group? Are all parts identical before and after a process has been changed? (These group differences can be the result of machining, process, or procedural changes. They can be used not only to generate clues but also to ascertain verification results after a process or system has been changed.)
A fifth unusual difference is caused by some systematic occurrence that results in a part that can be considered to be an outlier because it is highly distinct from other parts in the group. (This could be caused by conditions such as operator error, power outage, or wrong programming of automatic machine functions.)
This section indicated some of the variations that can be experienced by components in a manufacturing process. The most observable differences found are of the most interest as they present the major clues that require investigation.
1. 4 Comparison of twin sets Twins sets are those that contain matched sets of two. (The set should contain one of the best and one of the worst conditions for the sample.) In most cases, it is beneficial to establish five twin sets with a matched set of one of the favorable and one of the unfavorable conditions that is being evaluated. The more obvious the difference between the good and bad twin conditions the stronger will be the comparisons made. Each of the five twin sets is evaluated based on specific criteria, and the different twin comparisons either generate a similar relationship and se...