![]()
1 Enhanced Public Health Program Collaboration through Data Integration
1.1 INTRODUCTION
Public health assessment and surveillance require programs to seamlessly collaborate and work together, not only on emergency issues, but also on daily issues such as chronic disease prevention and health risk reduction. Historically, public health functions were served by a few entities or individuals and, in many cases, by the same individuals, or a team led by the same individuals. Two thousand years ago, Hippocrates studied the impacts of our surrounding environment, such as climate, soil, and water, on health. He used his knowledge, such as avoiding dampness and swamps in residential locations, to guide the settlement of Greek colonies in other parts of the Mediterranean. Quarantine, which was first introduced in the Middle Ages in Venice, also requires collective actions or collaborations among different individuals or programs. In medieval times, food inspection, disinfection, waste disposal isolation, and quarantine were regulated by medieval city councils.
In the United States, collective actions and cross-referencing multiple datasets for disease surveillance have a long history (Rosen, 1993). Shattuck’s 1850 report recommended that health prevention programs in Massachusetts use mortality data, population census data, and location-specific incidence, occupation, and socioeconomic status (SES) data. Based on John Snow’s study in London, the New York Board of Health in 1866 instituted sanitation measures that included inspections, immediate case reporting, complaint investigations, evacuations, and disinfection of possessions and living quarters. These efforts kept an outbreak of cholera at bay, while cities without a public health system for monitoring and combating the disease fared far worse in the 1866 epidemic. Similar collective efforts, such as information sharing followed by immediate actions, have persisted in infectious disease control. However, as programs are getting bigger and bigger, the collaboration root of public health is getting weaker and weaker, especially in the area of chronic disease prevention. The erosion of the collaboration tradition of public health programs has caused major concerns in information sharing and interprogram disease surveillance and prevention.
The fragmentation of public health programs and lack of communication among them are rooted in organizational and funding stream fragmentation, which individuals can hardly overcome. In the process of drafting the Institute of Medicine (IOM) public health report (1988), the U.S. Committee for the Study of the Future of Public Health visited six states in the United States and identified several issues. In terms of public health organizations, the committee found that regardless of organization, health services were often fragmented along organizational lines, with almost no communication among the public health–related programs or organizations, such as mental health, social services, and public health services. The committee identified 10 barriers for effective public health actions, and 3 of them related to translating data to knowledge. They included disjointed decision making without necessary data and knowledge, organizational fragmentation, and disparate knowledge development across the full array of public health needs. To the greatest extent, these assessments are still true, and in some cases, they are even exacerbated.
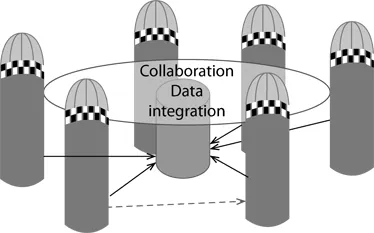
As a result, when new questions or challenges arise that require collaboration, individual public health practitioners (e.g., surveillance specialists and epidemiologists) often do not have the time and energy to spend on them. Since the IOM report, tremendous progress has been made in integrating data at both the national and state levels. In addition, many individual programs and individuals from a program often take their own initiatives to collaborate and use integrated data to advance our knowledge in public health. In this book, we promote data integration to aid crosscutting program collaboration. Figure 1.1 provides a diagram to highlight our idea. Each silo in the figure represents a public health program, and the circle represents a crosscutting activity table. Data integration provides a common language among programs to share and act on.
FIGURE 1.1 Data integration and program collaboration.
Such a data integration approach is the key to evidence-based health disparity assessments. A key dimension in health disparities is racial disparities in health. The traditional program-based public health activities and reporting are based on each silo, such as women’s health, the cardiovascular disease (CVD) program, the cancer prevention program, smoking and tobacco control, and home visitation. Health statistic reports within a public health agency are also organized by public health program or subject area. Examples include behavioral health, mental health, vital statistics, cancer, and radon reduction. If one wants to conduct a racial health disparity assessment, data have to either come from many programs or cut through many program areas. In addition to race or ethnicity, SES also cuts through many programs. As a disparity assessment expands to cover more program areas along a health disparity dimension, it is natural that the resultant report would lack depth and rely on programs to carry out in-depth assessments.
The focus on width and crosscutting in health disparity assessments fits well with chronic disease surveillance. Years after the epidemiologic transition in the United States, the Centers for Disease Control and Prevention (CDC) started to develop chronic disease indicators, which cover a wide range of public health areas from many datasets (CDC, 2004). Surveillance based on chronic disease indicators means pulling and manipulating data from different sources, programs, agencies, and organizations. In 2013, the expanded list of chronic disease indicators included 124 indicators and 201 individual measures from more than 20 data sources (CDC, 2015). Monitoring those indicators requires data integration, program and agency collaborations, and unprecedented infrastructure development. Analogously, the requirements for monitoring chronic disease indicators are also applicable to capacity building for health disparity assessments. In the rest of this chapter, we first review some of the efforts at the national and state levels and then summarize data integration efforts in Nebraska. Finally, we provide an outline of the book.
1.2 DATA INTEGRATION AT THE NATIONAL AND STATE LEVELS
At the national level, the National Center for Health Statistics (NCHS) has a data linkage program for linking interagency datasets. The National Health Interview Survey (NHIS), National Health and Nutrition Examination Survey (NHANES), and Longitudinal Study of Aging have been linked to the National Death Index (NDI) for mortality outcomes. These datasets have also been linked to Medicare enrollment and claims data and Social Security Administration (SSA), Retirement, Survivors, and Disability Insurance (RSDI), and Supplemental Security Income (SSI) data. In addition, the National Institutes of Health (NIH) and National Science Foundation (NSF) founded surveys such as the Panel Study of Income Dynamics surveys and the Health and Retirement Survey that have both been linked to the Medicare claim data to obtain health care costs and diagnoses from respondents. Surveillance, Epidemiology, and End Results (SEER) cancer registry data have also been linked to Medicare records. In addition, individual respondents in most national surveys are also geocoded to the census tract unit to obtain neighborhood characteristics. Most federal linkage programs have broad public policy impacts and have generated countless academic publications, policy briefings, and data reports. Together, they demonstrate the fruitfulness of these collaborations.
At the state level, programs in data sharing and data integration have been uneven. Most states do not fund large-scale surveys. The Behavioral Risk Factor Surveillance System (BRFSS) is funded by the CDC. Respondents from the surveys cannot be identified or linked to other health claim and mortality data. However, some states use BRFSS as the basis to conduct sampling among children, such the Children’s Health Assessment Survey (CHAS) in South Carolina, in which case both the parents’ survey and children’s health survey can then be linked. In addition, some state and city surveys, such as California Health Interview Survey (CHIS), have added geographic and environmental variables. Other than survey data, individual states have their own priorities, and some data are linked for case finding and ascertainment and health outcomes. Depending on need and sometimes leadership, some states had a robust data integration program for a few years, and then discontinued it.
South Carolina, for instance, had a vibrant data linkage program across many state agencies. The program was part of the federal initiative that provided funds to states with the intent to link administrative data from many sources to identify welfare recipients (Ver Ploeg et al., 2001). The program in South Carolina was wide ranging, with its impacts extending far beyond the original program design (Wheaton et al., 2012). The initial project attempted to check eligibility for participation in social services, mental health services, disability services, alcohol and drug abuse programs, educational programs, the criminal justice system, elderly services, housing programs, public safety programs, and disease, immunization, and child abuse registries in more than a dozen state government agencies. The integrated data were also designed to determine the prevalence of many diseases and conditions via hospital discharge data and emergency visit data for recipients of food stamps or Temporary Assistance to Needy Families (TANF). It turned out that the system was much more useful than originally designed. An example is identifying children with special care needs (CSCN), such as juvenile-onset diabetes, complex congenital heart disease, and genetic syndromes (trisomy 13, 18, or 21). The Children’s Rehabilitative Services (CRS) in the Department of Health and Environmental Control provided services to CSCN. The CRS used International Classification of Diseases, Ninth Revision (ICD-9) codes from Medicaid, inpatient hospitalization, outpatient surgeries, emergency department visits, and the state government employee health plan to identify CSCN. In addition, it linked relevant data files from the Department of Mental Health, the Department of Disabilities and Special Needs, the Department of Vocational Rehabilitation, the Department of Education, and the Department of Social Services. By integrating all of these separate systems using the definition provided, an unduplicated list of more than 340,000 children with special health care needs was developed. This was in stark contrast to the 10,000 CSCN that the CRS served at the time. Although the linkage program in South Carolina generated many external benefits, the lack of a sustainable operational model among agencies eventually doomed its fate. The statewide program of health service data linkage and integration ceased due to recessions and other funding issues.
In most cases, funds are provided through an existing public health program for data linkage that is narrow in scope and practice. In Chapter 14, we review birth outcome–related linkage programs. Here, we review one of the recent programs: the Special Projects of National Significance Program’s Systems Linkages and Access to Care for Populations at High Risk of HIV Infection. The initiative funded six demonstration states (Louisiana, Massachusetts, New York, North Carolina, Virginia, and Wisconsin) to design, implement, and evaluate innovative strategies to integrate different components of the public health system, such as surveillance, counseling, testing, and treatment, to create new and effective systems of linkages and retention in care for hard-to-reach HIV populations who have never been in care, have fallen out of care, or are at risk for falling out of care. The prison population is hard to reach, and the Louisiana project was designed to expand HIV testing to jails and prisons, so that prison and jail linkage coordinators and peer coordinators can be utilized to provide prerelease planning services to HIV-infected inmates and ensure they are linked with appropriate medical and social services before release. All of these pilot projects had a novel component that differed from that of the other states. A challenge is to identify a sustainable linkage operation targeting a specific population or program common to all the states.
Both the federal and state data linkage initiatives suggest that technologies for data linkage have matured enough that it would not be difficult to implement at any level. However, program- or project-based data linkage has been piecemeal, and it tends to generate few external benefits beyond the program’s specific needs. For instance, the breast and cervical cancer screening program, or what used to be called the Every Woman Matters (EWM) program in Nebraska, is required to link the positive screening individuals to a cancer registry to verify their Medicaid care status. Program staff involved in data linkage can easily conduct a program evaluation project by incorporating a data linkage component, but the lack of communications between programs hinders program specialists to go beyond a program-mandated evaluation. However, the program epidemiologist is not trained or authorized to analyze cancer registry data, while the cancer epidemiologist or biostatistician is not required to analyze EWM program data. For this reason, both programs rarely go beyond their mandated requirements to conduct cross-program data analysis projects. There are many similar programs within a state public health agency, and they conduct routine and ad hoc data linkage, serving regulatory and other funding requirements, but they rarely go beyond mandated operations. Such smaller linkage operations are inefficient with limited externalities. If resources can be pooled together, then a bottom-up linkage operation can be sustained through the participation of all relevant programs. Such an approach is infrastructure-oriented data linkage. In addition, to serve the existing program data linkage needs in a business-as-usual mode, the infrastructure-based data linkage products can enhance program collaborations that could never be achieved through piecemeal data linkage through each silo program.
1.3 INFRASTRUCTURE APPROACH TO DATA INTEGRATION
Most data linkage initiatives above are project oriented. Even though they provide data integration and data sharing, they tend to focus on integrating a number of datasets to enhance one dataset. Alternatively, we could think of public health data integration from the infrastructure building perspective. This perspective is to find the best way to enhance data infrastructure for broad public health applications. Program-based data integration and enhancements tend to focus on a program’s need. For instance, a social determinant project for the CVD program would only extract CVD-related diseases and outcomes from the hospital discharge data. Any data enhancements (e.g., geocoding patients to census tracts) and data integration (e.g., linking census tract SES variables) would be program specific. The infrastructure building perspective, in contrast, would geocode the entire hospital discharge data and link them with census tract variables, so that many programs would be able to use the hospital discharge data to extract program-specific diseases and outcomes, together with enhanced variables. A major goal is to level the public health practice field so that smaller or poorly funded programs can just as easily access and use enhanced data as the well-funded programs. At the same level of data integration platform, public health programs can use enhanced data for collaboration, and researchers can use the enhanced data for secondary data analysis.
To enhance public health data infrastructure, we felt that the guiding principle should be that once a program dataset is linked to another dataset, it should be good for crosscutting collaboration, rather than going back to the silo. Health disparity assessment is a crosscutting activity among programs; if we keep thinking about what needs to be done to enhance data elements in health disparity assessments, the eventual integrated data are likely to serve many programs. In a program-oriented data linkage project, a program dataset is often linked to another program’s data for a project-specific need. As shown in Figure 1.1 (dashed line), a program-to-program request is sufficient, and it does not require communications with other programs. A health disparity–oriented data linkage project is more comprehensive; it almost always requires crosscutting activities and communications among many public health programs. Regardless of which disparity dimension (race or ethnicity, gender, SES, or rural–urban status) is investigated, a comprehensive report often requires data extraction from many existing programs, and comparisons are made for many diseases or conditions. In Figure 1.1, the solid lines represent an infrastructure enhancement project that requires linkable data from major public health programs. After data linkage and integration, all programs on the table can collaborate based on shared data resources and linked variables.
In order to have program data talk to each other, it is necessary to develop a master data index that creates an index sheet for all program data. Through the master index sheet or lookup table, a record in a program can then be found in all indexed programs. Such an index has no differences in how customers are indexed; for example, for a utility company, a customer could be indexed by the (1) location for the meter reading, (2) type of repa...