
eBook - ePub
International Encyclopedia of Technical Analysis
- 350 pages
- English
- ePUB (mobile friendly)
- Available on iOS & Android
eBook - ePub
International Encyclopedia of Technical Analysis
About this book
Investors are firmly entrenched in two camps: those who believe that economic and financial fundamentals are the keys to investment success, and those who prefer some form or other of technical analysis. To serve those who use technical analysis, the authors have written a practical, useful, and comprehensive guide to all the major and minor technical analysis systems used by today's investors and financial professionals. In this unique reference book, technical analysis systems are discussed in depth, with detailed attention to the pros and cons of each. In addition, the Encyclopedia offers a mini-dictionary of the terms, concepts, and market issues that are part of the discipline of technical analysis.
Trusted by 375,005 students
Access to over 1.5 million titles for a fair monthly price.
Study more efficiently using our study tools.
Information
A
ACCUMULATION AND DISTRIBUTION
Accumulation is the buying of large amounts of shares in expectation of a significant increase in stock price, often by individuals with deep knowledge of the company who are of the opinion that the stock is undervalued. The accumulation phase is the initial phase of a major upward trend when astute investors will be buying securities. The stock is said to be going from weak hands to strong hands. It may be that bad news has already been discounted by the market. Accumulation takes place when the demand for a security exceeds the supply of it.
An institutional investor may attempt to buy a significant number of shares in a company in a controlled way so as to minimize driving up the stock price. The institutional investor’s accumulation plan may take weeks or months to finalize.
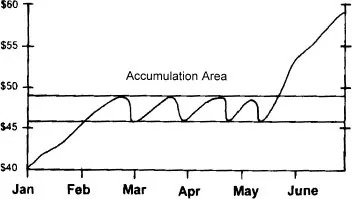
The accumulation area (see Figure A.1) refers to the price range within which purchasers accumulate shares of a stock. Technicians identify accumulation areas when a security does not drop lower than a specified price. Technical analysts who use the on-balance volume approach to analysis recommend purchasing stocks that have reached their accumulation area, since the stocks can be anticipated to attract more buying interest.
When net volume is constant or rises when prices are dropping, there is accumulation under weakness and a reversal is likely.
Distribution is when a significant amount of shares are sold in expectation of a major decline in stock price. Those doing the selling are sophisticated and knowledgeable about the company. They are of the opinion that the stock is overvalued. Distribution results in lower stock prices on significant volume that is going from strong hands to weak hands.
FIGURE A.1— | ACCUMULATION VERSUS DISTRIBUTION |
An institutional investor may sell a large block of shares in such a way that the adverse impact on prices is kept to a minimum. Technicians examine a pattern of distribution as an indication that the price of a stock will soon decline.
Constant or declining net volume with a price increase points to distribution under strength and an expected reversal.
Accumulation/distribution is a measure of momentum that compares changes in volume and price. It is assumed that a price move is more significant with increased volume. An increase in accumulation/distribution indicates that the stock is being accumulated (bought), since most of the volume is tied to the increasing movement in price. A decrease in accumulation/distribution means the stock is being distributed (sold), since most of the volume is applicable to the downward movement in prices.
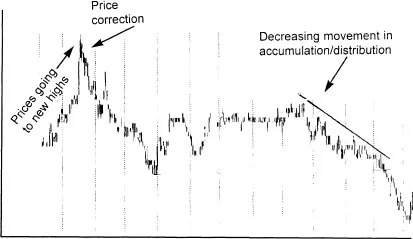
A change in stock price is expected when accumulation or distribution and the stock price diverge. If there is a divergence, prices typically change to be consistent with the accumulation or distribution. Therefore, for instance, if the accumulation/distribution indicator is going down and the stock price is going up, a reversal in price is likely.
Example: ABC Company’s stock price diverged when it went to a new high while the accumulation was decreasing. A correction in prices confirmed the indicator (see Figure A.2).
FIGURE A.2— | ACCUMULATION VERSUS DISTRIBUTION |
The formula for calculating accumulation/distribution is:
Volume x <(close − low) − (high−close)/(high − low)>
A part of the volume for each day increases or decreases the cumulative total. The closer the ending price is to the high for the day, the more is the volume added to the cumulative total; if it close to the low, the more is subtracted. Of course, if the ending price is exactly mid-point between the low and high prices, the cumulative total remains the same.
According to Larry Williams, accumulation (buying) should take place if a stock is going to a new low while the advance-decline ratio fails to make a new low. Distribution (selling) should take place if a stock is going to a new high while the advance-decline ratio does not.
The Williams’ accumulation/distribution indicator involves ascertaining the true range low (TRL) and the true range high (TRH).
TRL = Lower of yesterday’s close or today’s low
TRH = Higher of yesterday’s close or today’s high
Today’s accumulation/distribution is then derived by comparing yesterday’s ending price with today’s.
1. If today’s close is identical to yesterday’s close:
Today’s advance-decline (A/D) is 0.
2. If today’s close is below yesterday’s close:
Today’s A/D = Today’s Close − TRH
3. If today’s close exceeds yesterday’s close:
Today’s A/D = Today’s Close − TRL
Williams’ A/D = Today’s A/D + Yesterday’s Williams’ A/D
The Accumulation Swing Index developed by Welles Wilder in New Concepts in Technical Trading Systems is a cumulative total of the Swing Index.
It attempts to depict a phantom price line of the “real” market considering open, low, high, and closing prices. The index may be evaluated using support/resistance, with consideration given to divergences, new highs and lows, and breakouts. The index reflects a numerical value quantifying price swings, shows near-term swing points, and reveals market direction and strength.
ADVANCE/DECLINE LINE
See Breadth Analysis.
ALTERATION PRINCIPLE
Alteration principle is the theory that the stock market typically does not behave exactly the same twice in a row. For example, if a certain type of top in the market took place last time, it is not likely to do so again.
APEX
Apex is where two lines intersect in a triangle. In the case of a wedge, the apex is characterized by two converging trendlines.
ARBITRAGE
The simultaneous buying and selling of the same or complementary securities, commodities, or currencies in different markets. The arbitrageur buys the security on the exchange with the lower price and simultaneously sells it on the exchange with the higher price. Arbitrage takes advantage of market inefficiencies, while eliminating them.
Example 1: Stock XYZ is trading on the New York Stock Exchange for $5 per share and trading at the same time on the London Exchange for $5.50 per share. A member broker buys 5,000 shares of the stock on the New York Stock Exchange and simultaneously sells 5,000 shares on the London Exchange. The profit is:
(5.50 − $5.00) × 5,000 = $2,500
Example 2: An arbitrageur simultaneously buys one contract of silver in the New York market and sells one contract of silver at a higher price in the Chicago market, making a profit.
Some arbitrageurs buy stock of a firm that may be acquired by another and short the stock of the acquiring entity. If the acquisition takes place, a profit arises; if not, a loss.
ARMS INDEX (TRIN)
The Arms Index (TRIN for Trading Index), developed by Richard W. Arms, Jr., is a short-term trading index that offers the day trader especially a look at how volume—not time—governs stock price changes. It is also commonly referred to by its quote machine symbols, TRIN and MKDS. The Arms Index is designed to measure the relative strength of the volume associated with advancing stocks versus that for declining stocks. If more volume goes into advancing than declining stocks, the Arms Index will fall to a level under 1.00. If more volume flows into declining stocks than advancing stocks, the Arms Index will rise to a level over 1.00.
The index helps signal price changes in market indexes as well as individual issues. You will find Arms indices for the NYSE, the OTC market, the AMEX, and Giant Arms (a combined index for OTC and AMEX). The Bond Ar...
Table of contents
- Cover
- Title Page
- Copyright Page
- Dedication
- Table of Contents
- Acknowledgments
- About the Authors
- Preface
- Introduction
- Encyclopedia of Technical Analysis: A – Z
- Appendix A: Sources of Technical Data
- Appendix B: Subscription Charting Services
- Index
Frequently asked questions
Yes, you can cancel anytime from the Subscription tab in your account settings on the Perlego website. Your subscription will stay active until the end of your current billing period. Learn how to cancel your subscription
No, books cannot be downloaded as external files, such as PDFs, for use outside of Perlego. However, you can download books within the Perlego app for offline reading on mobile or tablet. Learn how to download books offline
Perlego offers two plans: Essential and Complete
- Essential is ideal for learners and professionals who enjoy exploring a wide range of subjects. Access the Essential Library with 800,000+ trusted titles and best-sellers across business, personal growth, and the humanities. Includes unlimited reading time and Standard Read Aloud voice.
- Complete: Perfect for advanced learners and researchers needing full, unrestricted access. Unlock 1.5M+ books across hundreds of subjects, including academic and specialized titles. The Complete Plan also includes advanced features like Premium Read Aloud and Research Assistant.
We are an online textbook subscription service, where you can get access to an entire online library for less than the price of a single book per month. With over 1.5 million books across 990+ topics, we’ve got you covered! Learn about our mission
Look out for the read-aloud symbol on your next book to see if you can listen to it. The read-aloud tool reads text aloud for you, highlighting the text as it is being read. You can pause it, speed it up and slow it down. Learn more about Read Aloud
Yes! You can use the Perlego app on both iOS and Android devices to read anytime, anywhere — even offline. Perfect for commutes or when you’re on the go.
Please note we cannot support devices running on iOS 13 and Android 7 or earlier. Learn more about using the app
Please note we cannot support devices running on iOS 13 and Android 7 or earlier. Learn more about using the app
Yes, you can access International Encyclopedia of Technical Analysis by Joel G. Siegel,Jae K. Shim,Anique A. Qureshi,Jeffrey Brauchler in PDF and/or ePUB format, as well as other popular books in Business & World History. We have over 1.5 million books available in our catalogue for you to explore.