- 417 pages
- English
- ePUB (mobile friendly)
- Available on iOS & Android
eBook - ePub
About this book
Social Interaction Systems is the culmination of a half century of work in the field of social psychology by Robert Freed Bales, a pioneer at the Department of Social Relations at Harvard University. Led by Talcott Parsons, Gordon W. Allport, Henry A. Murray, and Clyde M. Kluckhohn, the Harvard Project was intended to establish an integrative framework for social psychology, one based on the interaction process, augmented by value content analysis. Bales sees this approach as a personal involvement that goes far beyond the classical experimental approach to the study of groups.Bales developed SYMLOG, which stands for systematic multiple level observation of groups. The SYMLOG Consulting Group approach was worldwide as well as interactive. It created a data bank that made possible a search for general laws of human interaction far beyond anything thus far known. In his daringsearch for universal features, Bales redefines the fundamental boundaries of the field, and in so doing establishes criteria for the behavior and values of leaders and followers. Bales offers a new "field theory," an appreciation of the multiple contexts in which people live.Bales does not aim to eradicate differences, but to understand them. In this sense, the values inherent in any interaction situation permit the psychologist to appreciate the sources of polarization as they actually exist: between conservative and liberal, individualistic and authoritarian, libertarian and communitarian. Bales repeatedly emphasizes that the mental processes of individuals and their social interactions take place in systematic contexts which can be measured. Hence they permit explanation and prediction of behavior in a more exact way than in past traditions. Bales has offered a pioneering work that has the potential to move us into a new theoretical epoch no less than a new century. His work holds out the promise of synthesis and support for psychologists, sociologists, and all who work with groups and organizations of all kinds.
Trusted by 375,005 students
Access to over 1.5 million titles for a fair monthly price.
Study more efficiently using our study tools.
Information
Part 1
Theory and Methods
1
Overview of the SYMLOG System
I begin with a reprint of an instructional booklet I have written for SYMLOG Consulting Group. The booklet is designed to introduce consultants and others to the methods and theories of the present system. The consultant's perspective is my preferred perspective for the formulation of the theory. This perspective is essentially similar to the perspective of a leader, or active participant, who wishes to improve or maintain the effectiveness of a specific system, and believes that strategic information about the system will help.
This perspective confronts the major practical and pragmatic problems, as well as the value dilemmas and ethical problems, involved in the application and in the further testing and development of the theory and methods. It brings many features into focus that might otherwise be ignored or lost to sight in more abstract theorizing. Academic theorists will see many familiar features in perspective and with operational definitions.
The booklet is meant to be as simple and concrete as possible. It presents a picture of a specific group with named members. It introduces the necessary language for talking about the group and similar groups, the individual members, the theories, and the methods in relation to each other. The following chapters of the book are designed to further explain and enlarge on the history and development of the various features. The present picture is designed to enable the reader to keep the various features of a complex system in a single global focus.
Introduction
The SYMLOG System is a theory of personality and group dynamics integrated with a set of practical methods for measuring and changing behavior and values in a democratic way. It is designed for application in a specific group in its natural situation. The theory and methods are applicable to many kinds of groups and situations. Typically the purpose is to understand the group better in order to improve productivity and satisfaction. The theory and measurements indicate specific ways in which leaders and members can most effectively act to encourage desirable changes in group performance and to reduce stress.
Applications include assessment of the teamwork and leadership potential of individuals for selection and training, the composition of groups and improvement of teamwork, leadership training, and the training of educators in a broad sense, including teachers, coaches, therapists, and other professionals who work primarily with people. The method also provides information and facilities for many kinds of fundamental and applied research in social psychology and sociology.
What Does the Name SYMLOG Mean?
The name SYMLOG is an acronym for (1) Systematic, (2) Multiple Level, (3) Observation of Groups.
Systematic
The theory and methods provide ways for leaders and group members to measure and consider a more complete and strategic set of variables involved in their behavior and values than would otherwise be possible. The conceptual framework is fundamental, comprehensive, and well structured. The basic research has been conducted over a long period—more than forty years—by the author and his colleagues at Harvard University, and more than fifteen years in business teams and organizations in the United States and other countries. The methods are reliable, valid, and rugged over a broad range of conditions.
Multiple Level
There are a number of methods of measurement for specific purposes. The various methods enable one to measure many aspects, or levels, of individual behavior, including the internal psychological aspects (perceptions, attitudes, values, concepts) as well as nonverbal behavior, overt behavior, and the value content of communication.
The methods for integrating the measurements enable one to obtain a higher level understanding of: (a) the internal dynamics of individual personalities; (b) the relationships of particular group members to each other; (c) the overall dynamic tendencies of the total group; and, (d) the effects of the broader organizational culture on the inner workings of the group.
Observation of Groups
The findings on which the theory is based are the result of systematic observation of real groups. The research has concentrated on the ways in which individuals with different kinds of personalities affect each other in task-oriented groups. Measurements are based on practical observations. The most practical method in applications consists of ratings of the frequency of various kinds behavior and values, made by group members who know each other well.
An analysis of a group may be based on the perceptions of a leader, or single other member, if necessary. But reliability and validity are greatly improved if most or all of the group members contribute their observations. Observations by external observers can also be included. Corrections for individual biases or differences of perspective between different observers are built into the methods. Assessments of individuals for selection or training are always based on ratings by multiple observers.
How Are the Observations Used?
All measurements are integrated and analyzed by the use of expert computer programs to produce graphic displays and written reports. If the members wish to share their information, they may see exactly how each of them sees the group. Or, if they wish, they may preserve any desired degree of confidentiality. Arrangements as to confidentiality and degree of detail of the data feedback to individuals and the group are made in advance.
An individualized Report is addressed to each group member. The Report may show how that individual sees each other member. It may show the way others see the individual, giving tentative suggestions as to the reasons he or she may be seen in the given way, and what changes might improve teamwork. A similar Report based on group averages is addressed to the group as a whole.
The methods of measurement are maximally compact and efficient as to time and effort required. In many cases the data may be gathered, processed, and printed into reports within the time constraints of a single meeting. Discussion of the reports usually takes place, after time for study, in subsequent group meetings, or in coaching sessions of individuals with consultants.
Theoretical Background
SYMLOG theory is a comprehensive integration of findings and theories from psychology, social psychology, and sociology. It is unique in its breadth, its high degree of integration, and its practical implementation. It is a new field theory (Bales 1985).
As a field theory, SYMLOG takes effective account of the fact that every act of behavior takes place in a larger context, that it is a part of an interactive field of influences. The approach assumes that one needs to understand the larger context—personal, interpersonal, group, and external situation—in order to understand the patterns of behavior and to influence them successfully. The measurement procedures of SYMLOG are designed to measure the behavior patterns, the values, and their larger context.
The Field Diagram
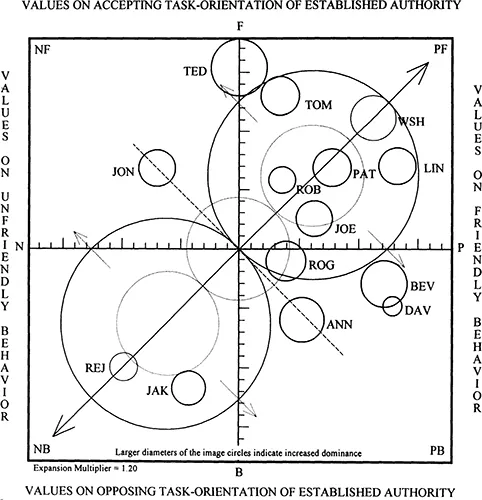
One of the major methods for integrating and drawing inferences from the measurements is the construction and analysis of the Field Diagram. The Field Diagram is a picture of a group that shows how individual members relate to each other and to the situation. Figure 1.1 presents an illustrative example.
The Field Diagram is a map. The location of each member is shown as a circle on the diagram, labeled with the member's code name. The circle in its particular location is called the image of the member. The circle size and location of the image in the field is based on the average of the way all members see the behavior and values of that member.
Figure 1.1
An Example Field Diagram
An Example Field Diagram
Source: © 1997 SYMLOG Consulting Group, San Diego, CA. Reprinted by permission.
The Field Diagram shows two scales crossing the areas and intersecting in the middle. These are called dimensions (P-to-N and F-to-B on the diagram). The dimensions of the field are scales that are used as coordinates, against which the locations of images are plotted. Points on the scales are the frequencies with which individuals show one aspect or another of certain bipolar behavioral characteristics. A large amount of research indicates that at least three such bipolar characteristics are fundamental, and probably universal (thus always need to be taken into account):
- Dominance versus Submissiveness;
- Friendliness versus Unfriendliness; and
- Acceptance versus Non-acceptance of Authority.
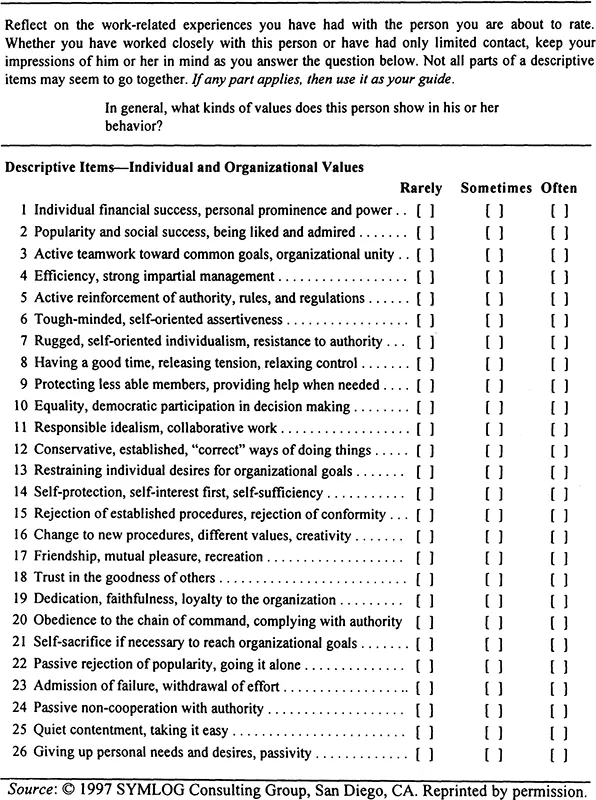
The frequency rates with which an individual behaves in each of these kinds of ways, or implies that a given kind of behavior is good or bad (makes evaluations or shows values in behavior), can be observed, rated as to frequency of occurrence, and located on a scale of frequency. These ratings are made by group members using a Rating Form shown as figure 1.2.
Each of the three dimensions is psychologically bipolar. The two ends of the dimension are evaluatively opposed to each other—if a person at a given time feels that a kind of behavior at one end is good, the kind of behavior at the other end is likely to be rejected as bad.
Thus, each dimension as shown on the Field Diagram really consists of two opposing directions. The middle of the diagram where the two scales cross is the zero point of both scales. Each dimension consists of two opposite directions—one direction from the zero point out to one extreme, and an exactly opposite direction from the zero point out to the other extreme.
Only two dimensions—Friendliness versus Unfriendliness, and Acceptance versus Non-acceptance of Authority—can be shown on the plane of the Field Diagram. But there are three dimensions of behavior to be portrayed. How is this inconvenience addressed?
Location in the first dimension, the Dominance versus Submissiveness of the individual, is not indicated by a scaled line on the diagram. Rather, it is represented metaphorically, by the size of the image circle standing for the member. A large image circle indicates that the individual is seen as Dominant; a small image circle means that the member is seen as Submissive.
The other two dimensions are represented directly on the plane of the Field Diagram as long lines with scale marks. The location of an image in one of the dimensions alone gives no information about its location on either of the other two dimensions. The two dimensions shown as scaled lines on the diagram are independent of each other. This is indicated by the fact that they cross each other at right angles in the middle of the diagram.
Figure 1.2
A Sample SYMLOG Consulting Group Rating Form, Individual and Organizational Values
A Sample SYMLOG Consulting Group Rating Form, Individual and Organizational Values
The meaning of the code letters at the ends of the dimensions can be understood by referring to the cube diagram shown as figure 1.3. The cube diagram is a model that shows the three dimensions as if they were the three dimensions of a physical space. The opposing directions are named as if the head of the viewer were placed in the exact center of the cube, looking toward F (for Forward). From this perspective, the physical directions are used to stand metaphorically for the psychological directions of the value and behavior space.
Figure 1.3
SYMLOG Cube Diagram
SYMLOG Cube Diagram
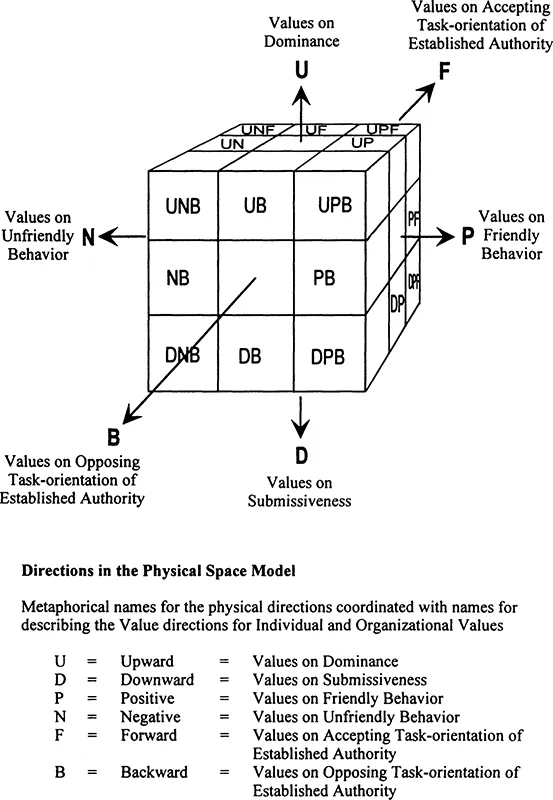
Figure 1.4
Individual and Organizational Values, Listed by Number and Vector
Individual and Organizational Values, Listed by Number and Vector
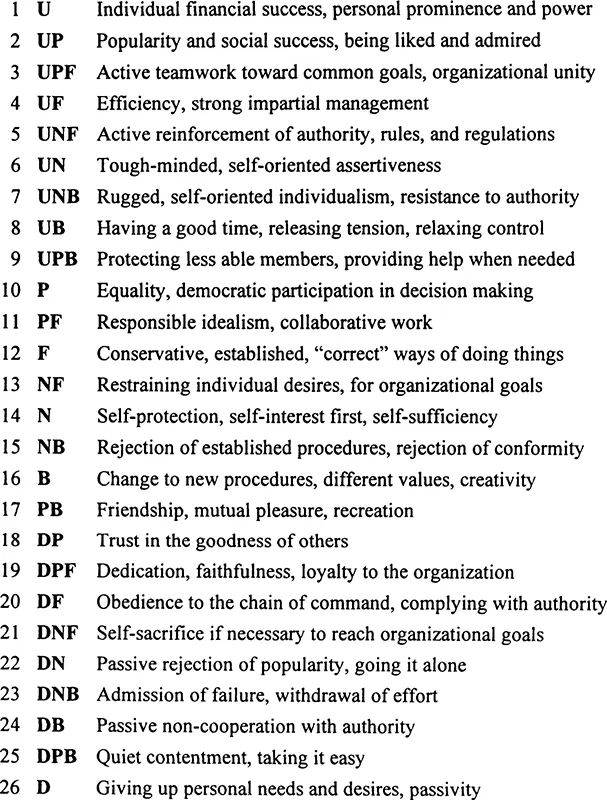
Source: © 1997 SYMLOG Consulting Group, San Diego, CA. Reprinted by permission.
The rater completes a response to each of the twenty-six items for each image rated. As the rater considers each item, the item functions as a kind of directional probe into the rater's complex global perception of the person or concept being described, called the Image. Since all major directions in the value and behavior space are thus probed and measured, a very fine-grained description of the rater's perceptions of the Image is obtained. The twenty-six ”directions” are also called vectors and can be symbolized by twenty-six arrows pushing out from the center of the large cube. The correspondence between each of the value items, listed in their standard order, and its value “direction” out from the center of the large cube is shown in figure 1.4.
Dominance versus Submissiveness
The rating received by an individual in this dimension represents the prominence, status, power, and personal influence that the individual is seen by the rater to have in relation to other group members.
In figure 1.1 the circles representing TED, BEV, and ANN are larger than those of the other group members. Of these, TED's circle is the largest, which indicates that he is perceived by the group as the most dominant member. ROB and DAV have the smallest circles, meaning that they are seen as the most submissive members of the group.
Dominant members may be high participators, probably extroverts; they may also show a tendency to impose their views on the group. The more submissive members are typically seen as quiet, passive, or introverted. However, the full meaning of an image size or location cannot be understood from its location in any single dimension. The other two dimensions must be considered at the same time.
Friendliness versus Unfriendliness
Values on Unfriendly Behavior are shown on the left side of the diagram, and Values on Friendly Behavior, on the right side. An image on the left side of the diagram is often associated with behaviors and values perceived to be self-interested and self-protective, while images on the right side tend to be associated with behaviors and values perceived as equalitarian, cooperative, or protective of others.
In figure 1.1 the image labeled with the name of LIN is farthest toward the right or friendly side. Thus, LIN is seen as the friendliest person in the group. JON and JAK have images on the unfriendly side of the diagram. They are probably perceived as self-centered and individualistic.
(These descriptions, of course, are wholly inadequate except as code words. Detailed descriptions of the behavior and values that raters typically associate with given locations on the Field Diagram are included in the feedback reports, along with some suggestions as to possible reasons for the behavior, and its effects on teamwork.)
Acceptance versus Non-Acceptance of Authority
In the most general SYMLOG framework the term authority is understood in a very broad sense. It refers to a group environment of more or less organized social restraints and constraints, widely recognize...
Table of contents
- Cover
- Title Page
- Copyright Page
- Dedication
- Table of Contents
- List of Figures
- Preface
- Part 1: Theory and Methods
- Part 2: Values
- Part 3: Overt Interaction
- Part 4: Effectiveness
- A. The Intercorrelation Space
- B. Wordings of the Rating Questions for Nineteen Selected Images
- C. Average Value Frequency Profiles for Nineteen Selected Images
- D. Biographical Background
- Bibliography
- Index of Names
- Index of Topics
Frequently asked questions
Yes, you can cancel anytime from the Subscription tab in your account settings on the Perlego website. Your subscription will stay active until the end of your current billing period. Learn how to cancel your subscription
No, books cannot be downloaded as external files, such as PDFs, for use outside of Perlego. However, you can download books within the Perlego app for offline reading on mobile or tablet. Learn how to download books offline
Perlego offers two plans: Essential and Complete
- Essential is ideal for learners and professionals who enjoy exploring a wide range of subjects. Access the Essential Library with 800,000+ trusted titles and best-sellers across business, personal growth, and the humanities. Includes unlimited reading time and Standard Read Aloud voice.
- Complete: Perfect for advanced learners and researchers needing full, unrestricted access. Unlock 1.5M+ books across hundreds of subjects, including academic and specialized titles. The Complete Plan also includes advanced features like Premium Read Aloud and Research Assistant.
We are an online textbook subscription service, where you can get access to an entire online library for less than the price of a single book per month. With over 1.5 million books across 990+ topics, we’ve got you covered! Learn about our mission
Look out for the read-aloud symbol on your next book to see if you can listen to it. The read-aloud tool reads text aloud for you, highlighting the text as it is being read. You can pause it, speed it up and slow it down. Learn more about Read Aloud
Yes! You can use the Perlego app on both iOS and Android devices to read anytime, anywhere — even offline. Perfect for commutes or when you’re on the go.
Please note we cannot support devices running on iOS 13 and Android 7 or earlier. Learn more about using the app
Please note we cannot support devices running on iOS 13 and Android 7 or earlier. Learn more about using the app
Yes, you can access Social Interaction Systems by Robert Bales in PDF and/or ePUB format, as well as other popular books in Psychology & History & Theory in Psychology. We have over 1.5 million books available in our catalogue for you to explore.