chapter one
The technical approach to trading and investing
Few human activities have been so exhaustively studied during the past century, from so many angles and by so many different sorts of people, as the buying and selling of corporate securities. The rewards the stock market holds out to those who read it right are enormous; the penalties it exacts from careless, dozing, or “unlucky” investors are calamitous. No wonder it has attracted some of the world’s most astute accountants, analysts, and researchers, along with a motley crew of eccentrics, mystics, “hunch players,” and a multitude of just ordinary hopeful citizens.
Able brains have sought, and continue constantly to seek, for safe and sure methods of appraising the state and trend of the market, as well as discovering the right stock to buy and the right time to buy it. This intensive research has not been fruitless—far from it. There are a great many successful investors and speculators (using the word in its true sense, which is without opprobrium) who, by one road or another, have acquired the necessary insight into the forces with which they deal and the judgment, the forethought, and the all-important self-discipline to deal with them profitably.
In the course of years of stock market study, two quite distinct schools of thought have arisen, providing two radically different methods of arriving at the answers to the trader’s problem of what and when. In the parlance of “the Street,” one of these is commonly referred to as the fundamental or statistical, and the other as the technical. (In recent years a third approach, the cyclical, has made rapid progress, and although still beset by a “lunatic fringe,” it promises to contribute a great deal to our understanding of economic trends.)
The stock market fundamentalist depends on statistics. He examines the auditors’ reports, the profit-and-loss statements, the quarterly balance sheets, the dividend records, and the policies of the companies whose shares he has under observation. He analyzes sales data, managerial ability, plant capacity, and the competition. He turns to bank and treasury reports, production indexes, price statistics, and crop forecasts, to gauge the state of business in general, and reads the daily news carefully to arrive at an estimate of future business conditions. Taking all these into account, he evaluates his stock; if it is selling currently below his appraisal, he regards it as a buy. (EN9: And, no surprise, the buyer’s name is Warren Buffet, and he buys the company, not the stock, for although this is an excellent way to buy companies, it is not a very good way to buy stocks.) EN: Read Robert Prechter’s summation of the fundamental methodology as an amusing endnote at the end of this chapter.
As a matter of fact, aside from the greenest of newcomers when they first tackle the investment problem, and to whom, in their inexperience, any other point of view is not only irrational but incomprehensible, your pure fundamentalist is a rare bird. Even those market authorities who pretend to scorn charts and “chartists” utterly are not oblivious to the “action” chronicled by the ticker tape, and they do not conceal their respect for the Dow Theory, which, whether they realize it or not, is, in its very essence, purely technical.
Definition of technical analysis
The term “technical,” in its application to the stock market, has come to have a special meaning, quite different from its ordinary dictionary definition. It refers to the study of the action of the market itself as opposed to the study of the goods in which the market deals. Technical Analysis is the science of recording, usually in graphic form, the actual history of trading (price changes, volume of transactions, etc.) in a certain stock or in “the Averages” and then deducing from that pictured history the probable future trend. EN: With the advent of the computer, many schools of technical analysis have arisen. Number-driven technical analysis (e.g., moving average studies, oscillators, etc.) attempts to completely objectify the analysis of the markets. The work of Edwards and Magee is the embodiment and definition of “classical technical analysis.”
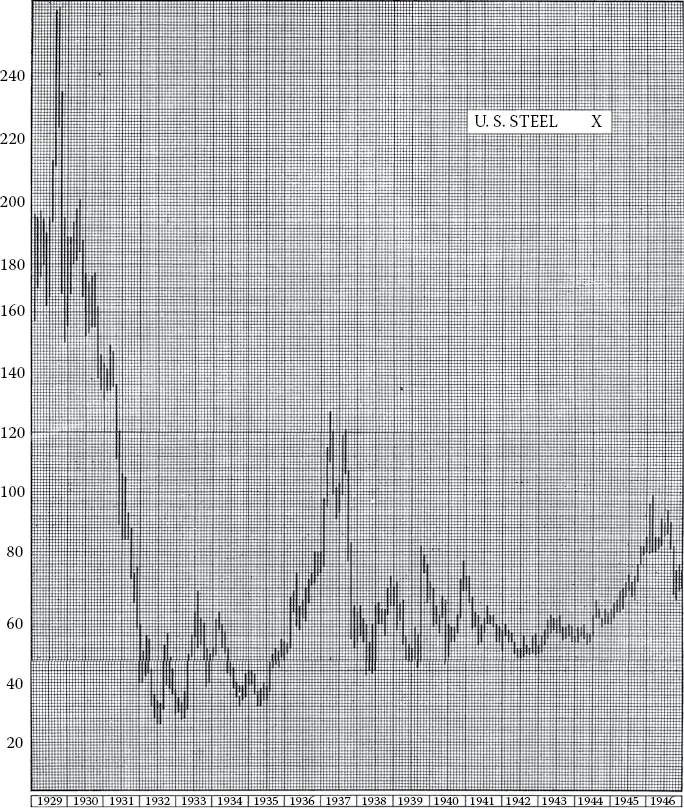
The technical student argues thus: it is futile to assign an intrinsic value to a stock certificate. One share of U.S. Steel, for example, was worth $261 in the early fall of 1929, but you could buy it for only $22 in June 1932. By March 1937, it was selling for $126 and just one year later it was selling for $38. In May 1946, it had climbed back up to $97, and 10 months later, in 1947, had dropped below $70, although the company’s earnings on this last date were reputed to be nearing an all-time high and interest rates in general were still near an all-time low. The book value of this share of U.S. Steel, according to the corporation’s balance sheet, was about $204 in 1929 (end of the year), $187 in 1932, $151 in 1937, $117 in 1938, and $142 in 1946. This sort of wide divergence between presumed value and actual price is not the exception—it is the rule. It is going on all the time. The fact is the real value of a share of U.S. Steel common is determined at any given time solely, definitely, and inexorably by supply and demand, which are accurately reflected in the transactions consummated on the floor of the New York Stock Exchange (see Figure 1.1).
Figure 1.1Monthly price ranges of U.S. Steel common from January 1929 to December 1946. Compare the great swings in the market price for this stock—from 1929 (extreme high, 261 3/4) to 1932 (extreme low, 21 1/4), from 1932 to 1937, from 1937 to 1938, from 1942 to 1946—with its book values for those years as cited on the previous page.
Of course, the statistics fundamentalists study play a part in the supply– demand equation—that is freely admitted. But many other factors are affecting it as well. The market price reflects not only the differing value opinions of many orthodox security appraisers, but also all the hopes and fears and guesses and moods, rational and irrational, of hundreds of potential buyers and sellers, as well as their needs and their resources—in total, factors that defy analysis and for which no statistics are obtainable, but that nevertheless are synthesized, weighed, and finally expressed in the one precise figure at which a buyer and a seller get together and make a deal (through their agents, their respective stock brokers). This is the only figure that counts.
Moreover, the technician claims, with complete justification, that the bulk of the statistics the fundamentalists study are past history, already out of date and sterile because the market is not interested in the past or even in the present. It is constantly looking ahead, attempting to discount future developments, weighing and balancing all the estimates and guesses of thousands of investors who look into the future from different points of view and through glasses of many different hues. In brief, the going price, as established by the market itself, comprehends all the fundamental information the statistical analyst can hope to learn (plus some that is perhaps secret from him or known only to a few insiders) and much else besides of equal or even greater importance.
All of which, admitting its truth, would be of little significance were it not for the fact, which no one of experience doubts, that prices move in trends and trends tend to continue until something happens to change the supply–demand balance. Such changes are usually detectable in the action of the market. Certain patterns or formations, levels or areas, appear on the charts that have a meaning and that can be interpreted in terms of probable future trend development. They are not infallible, it must be noted, but the odds are definitely in their favor. Time after time, as experience has amply proved, they are far more prescient than the best informed and most shrewd of statisticians.
The technical analyst may go even further in his claims. He may offer to interpret the chart of a stock whose name he does not know, so long as the record of trading is accurate and covers a long enough term to enable him to study its market background and habits. He may suggest he could trade with profit in a stock knowing only its ticker symbol, completely ignorant of the company, the industry, what it manufactures or sells, or how it is capitalized. Needless to say, such practice is not recommended, but if your market technician is really experienced at his business, he could, in theory, do exactly what he claims.
Should the reader, at this point, find the technical approach to trading or investing, as explained in the foregoing, completely abhorrent, perhaps he had better close the book now, for it is primarily the technical approach, the science of technical analysis, with which the remainder of the book deals.
EN: The Elliott Wave Theory: perspective and comments from a Magee investment letter of...