- 144 pages
- English
- ePUB (mobile friendly)
- Available on iOS & Android
eBook - ePub
About this book
With the advent of desktop publishing systems and user-friendly computer software, there is an increasing trend for educators and trainers to produce their own instructional material. This study provides guidelines for the design of basic, sound and unconfusing instructional diagrams.
Trusted by 375,005 students
Access to over 1.5 million titles for a fair monthly price.
Study more efficiently using our study tools.
Information
Topic
EducationSubtopic
Education General1
Diagrams and Learning
Uses of diagrams in instruction
How often have you heard instructors say that ‘a picture is worth a thousand words’? This statement reflects the common belief that visuals are somehow especially effective as a teaching resource. The diagram is a type of instructional visual that is widely used across many subjects, particularly those which involve technical subject matter. However, not all the diagrams found in teaching materials are equally successful in promoting the desired learning outcomes. This can be because the diagrams are so poorly designed that they actually hinder, rather than help, learning. However, even well-designed diagrams can be ineffective if the student is given insufficient support in how to use them. So, perhaps the adage about pictures could be rewritten as ‘a diagram can be worth a thousand words, provided it has been well designed and is sufficiently supported’.
As with any instructional resource, the main reason for using diagrams in teaching materials is to help students learn more efficiently and effectively. In many situations this means that instructional diagrams aim to teach students how to:
- perform new tasks in an acceptable way, or
- improve the way they perform their existing tasks.
For instruction to be judged successful, the students must be able to produce the new or improved performance as required. This typically means that they need to be able to remember what they were taught and in many cases also carry out tasks in a way that shows they understand what they are doing. So, if diagrams are to be instructionally successful, they should help students to:
- recall the knowledge and skills they have been taught, and
- understand the material that is being taught.
Recall and understanding are often seen as strongly related because of the effectiveness of instruction that results in meaningful learning. If a diagram can help a student understand the subject matter (ie make it meaningful), recall of that material is generally likely to be better than if the instruction did not emphasize understanding.
As well as aiding recall, a good understanding of the subject matter can support problem solving and transfer of learning beyond a particular instructional context. For these reasons, this book focuses upon the use of diagrams to develop understanding.
Some characteristics of diagrams
Although so far we have not distinguished between diagrams and other forms of pictures found in teaching/learning resources, diagrams are actually quite special. Some comparisons with other sorts of pictures will help make this clearer.
In the floral depiction in Figure 1.1, the flower looks much the same as it would in real life. The reasons that it looks quite realistic include the ‘natural’ arrangement of its parts and their smooth, graduated shading which gives the flower a three-dimensional quality. Contrast this with the second picture (Figure 1.2) in which flowers, leaves and stems are depicted in a heavily altered form. This turns them into a decoration in which these parts of the plant are treated as elements of a stylized pattern.
Because of their overall style and treatment of the subject matter, neither the realistic nor the decorative picture could be considered to be a diagram. However, the third representation (Figure 1.3) is immediately recognizable as a diagram, even if you are not completely clear about its meaning. Its overall style is an instant giveaway, despite the fact that it has none of the labels that are characteristic of most diagrams. Straight away we are aware of the fact that it is a two-dimensional line drawing carried out in a very formal and precise manner. On closer inspection, we may see it is actually a cross-section through a flower (definitely nothing like the flower's natural appearance) that reveals its internal reproductive parts. The diagram uses a variety of transformations which change the flower so it no longer looks realistic. These transformations include slicing it in half to show what's inside and simplifying many of its features. Shading and arrows have been added to help clarify the subject matter.

Figure 1.1 Realistic depiction of a flower. Shapes and shading give this picture a three-dimensional appearance which makes it resemble closely what we would expect to see in real life.

Figure 1.2 Decorative floral arrangement. Although the depiction involves some heavy transformation of flower forms, the purpose of this stylization is aesthetic, not explanatory.
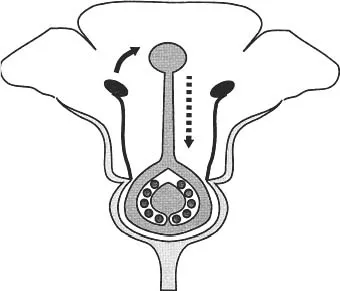
Figure 1.3 Diagram of a flower showing reproductive parts. Transformations are used to expose and make clear the internal structure of the flower giving greater explanatory power.
The aim of the third depiction is quite different from that of the previous two. It is intended to explain some things about the flower, in particular:
- the structure of the flower (the physical features of its parts and how they are arranged in space), and
- the process of reproduction (the changes that its parts are involved in over time).
Presenting new information about structure and processes is a common function of diagrams. We will return to these functions in more detail later in this book when we look at procedures for designing diagrams (Chapters 3, 4 and 5).
For now, we will concentrate on a specific diagram to highlight a number of important general characteristics of diagrams. This diagram (Figure 1.4) depicts the structure of a pepper mill used to grind peppercorns (a process diagram for this device will be presented later in Figure 4.2). We have chosen this particular subject matter simply because it is both a familiar household item and also gives us plenty of scope for explaining how diagrams work. (Many other types of content would have done equally well.)
With this diagram we will go some way further than just being able to recognize that it is a diagram (as we did with Figure 1.3, the third depiction of the flower). We will examine how it divides information between graphic material and associated text. Note that in the discussion that follows, the text we will consider is limited to that contained in the diagram's immediate labels and captions. For the present, we will not include more distant references to the diagram that may occur in the main body of a text in which the diagram is embedded. Ideally, the diagram's graphical and textual information should work together to help the student build up an appropriate understanding of the diagram as a whole.
The graphic components in the pepper mill diagram let us know such things as:
- what the various parts of the depicted object (pepper mill) look like (eg shape and size)
- where parts are located (eg at the top or bottom of the mill)
- which parts are attached or not attached (eg the handle is attached to the shaft but the toothed wheel is free to turn inside the grinding compartment)
- how parts are attached (eg the shaft is attached to the handle via a mounting and a knob).
The text lets us know:
- the identity of the object's components (eg the handle and the shaft)
- what view of the object we are looking at (cross-section, top or bottom view)
- how the object is structured (eg the handle and the toothed wheel of the grinder are connected by the shaft).
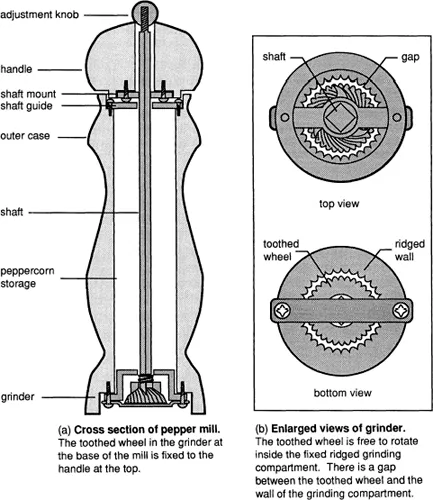
Figure 1.4 Structure diagram of a pepper mill. Shows the physical features of the mills parts and the way they are arranged in space. This diagram uses a composite of different views for clarity.
Notice how some of the information is repeated in that it is given in the form of both graphics and text. This is described as redundant encoding of information and can be a useful way to draw attention to what is of particular significance in a diagram. Other information is provided in only one of these forms and this is described as non-redundant encoding. This pattern of encoding can indicate highly visual or verbal material that is difficult to present effectively in an alternative format.
Notice also that although many of these types of information may be relevant to the way a pepper mill works, this is not a process diagram. It is intended to depict only the structure of the mill, not the sequence of events that takes place when peppercorns are ground into fragments. This distinction between structure and process is an important aspect of diagram design since it is often best to use different approaches for these two types of diagram.
Advantages and disadvantages of diagrams
The diagram of a pepper mill in Figure 1.4 contains some general features of diagrams that can either help or hinder learning, depending on the instructional situation (who is being taught, how the instruction is presented, what other materials accompany the diagram, etc). Typically, instructors focus upon the instructional advantages of diagrams without paying too much attention to the challenges that diagrams may present to the learner. For diagrams to be a successful part of instruction, a more even-handed consideration of their pros and consis needed. Let's see how this could be done for the pepper mill diagram.
Some of the potential instructional advantages of this diagram arise from:
- simplifying the subject matter by reducing it from a three-dimensional to a two-dimensional depiction so that the way parts of the pepper mill are arranged becomes easier to see;
- removing unnecessary detail that is present in the real object but which has no significance in terms of its overall structure (eg the wood grain pattern on the timber case);
- enlarging parts of the object to make their features clearer (eg the grinder section of the mill to show the nature of the surfaces that grind the peppercorns);
- providing a variety of revealing views of the subject matter that expose important parts of the structure (eg cross-sectional view, top view, bottom view);
- coding conceptually different regions of the structure with a limited number of characteristic types of shading to signal their nature (dark grey is for the metal components which comprise parts of the milling mechanism, light grey is for the wooden case, white is for a space or cavity). This makes it easier to identify different aspects of the structure;
- arranging related pieces of information in close proximity to encourage those pieces to be treated together in the interpretation of the diagram (eg the top and bottom views of the grinder grouped together inside the boxed area).
However, there are also potential disadvantages in using diagrams, particularly with students who are not adept in making the most of these resources. Possible problems that could arise with the pepper mill diagram include the following.
- Students who are uneasy with abstract, technical representations could be ‘put off’ by the style of depiction. They may be more at ease initially with a more realistic picture of the object.
- Some aspects of the object depicted are less easy to identify than if a realistic depiction had been used because of the extensive transformation they have undergone.
- Reducing the representation from three to two dimensions in the name of simplification inevitably throws away spatial information which may be crucial to a proper understanding of the object's structure.
- Students who are unused to dealing with diagrams in general may approach the diagram ‘literally’, in other words as if it actually showed what the subject matter looked like. Because diagrams ar...
Table of contents
- Front Cover
- Half Title
- Title Page
- Copyright
- Contents
- Series Editor's Foreword Chris Bell
- Introduction
- 1. Diagrams and Learning
- 2.Diagrams and Visual Literacy
- 3. The Diagram Development Process
- 4. Designing a Diagram
- 5.Producing a Diagram
- 6. Instructional Diagrams in Context
- 7. Integrating Diagrams in Instruction
- 8. Improving Instructional Diagrams
- 9. Helping the Diagram User
- 10. Conclusion
- Bibliography
- Index
Frequently asked questions
Yes, you can cancel anytime from the Subscription tab in your account settings on the Perlego website. Your subscription will stay active until the end of your current billing period. Learn how to cancel your subscription
No, books cannot be downloaded as external files, such as PDFs, for use outside of Perlego. However, you can download books within the Perlego app for offline reading on mobile or tablet. Learn how to download books offline
Perlego offers two plans: Essential and Complete
- Essential is ideal for learners and professionals who enjoy exploring a wide range of subjects. Access the Essential Library with 800,000+ trusted titles and best-sellers across business, personal growth, and the humanities. Includes unlimited reading time and Standard Read Aloud voice.
- Complete: Perfect for advanced learners and researchers needing full, unrestricted access. Unlock 1.5M+ books across hundreds of subjects, including academic and specialized titles. The Complete Plan also includes advanced features like Premium Read Aloud and Research Assistant.
We are an online textbook subscription service, where you can get access to an entire online library for less than the price of a single book per month. With over 1.5 million books across 990+ topics, we’ve got you covered! Learn about our mission
Look out for the read-aloud symbol on your next book to see if you can listen to it. The read-aloud tool reads text aloud for you, highlighting the text as it is being read. You can pause it, speed it up and slow it down. Learn more about Read Aloud
Yes! You can use the Perlego app on both iOS and Android devices to read anytime, anywhere — even offline. Perfect for commutes or when you’re on the go.
Please note we cannot support devices running on iOS 13 and Android 7 or earlier. Learn more about using the app
Please note we cannot support devices running on iOS 13 and Android 7 or earlier. Learn more about using the app
Yes, you can access Successful Instructional Diagrams by Ric Lowe,Lowe, Ric in PDF and/or ePUB format, as well as other popular books in Education & Education General. We have over 1.5 million books available in our catalogue for you to explore.