![]()
1. Introduction and Methodology
Woody-biomass resource assessments have rarely been undertaken on a regional scale for the purpose of energy planning. Where such assessments have been attempted, they have relied on secondary data derived from a variety of sources. This book illustrates the numerous problems involved in this type of survey and shows how they may be partially overcome by the integration of remotely sensed data, primary data collection, and secondary data.
Prior to this study, woody-biomass assessments for energy planning in the Southern African Development Co-ordination Conference (SADCC) region had been based on national forestry statistics and, to a much lesser extent, on ecological studies. The former are generally unreliable for such assessments due to the following reasons:
i) The level of resource assessment varies considerably between countries due to differentials in departmental funding, size of country, effectiveness of the forestry departments, and the techniques used. Therefore, within the SADCC region as a whole, estimates were inconsistent and regional assessments using a standard technique were a necessity.
ii) As most assessments had been made by foresters, they reflected the foresters’ concern with commercial timber production rather than fuelwood. A change of emphasis was needed.
iii) Population growth and redistribution, changing land-use patterns, increased commercial timber exploitation, and the increased demands for indigenous fuels meant that previous maps and estimates of woody biomass had quickly become outdated. Up-to-date assessments were, and still are, required for current energy-planning initiatives,
iv) Ecological studies, which have the potential to provide more useful, quantitative information on total biomass, are relatively rare in this area.
In summary it can be said that the current levels of biomass resource potential (i.e., existing stock and annual productivity) in SADCC member states were not accurately known. Up-to-date ecological assessments made using a standardized methodology were urgently required.
It is essential in both regional and national energy budgeting that accurate, up-to-date information is obtained. Given the poor quality of the existing material, the only feasible method for providing this kind of information for a large region (such as SADCC) over a short period was to use remotely-sensed data. This type of data had already been used to a certain extent at the country level within the SADCC region, for Botswana, Mozambique and Tanzania. However, some of these studies were out of date by the time this study began and they had generally failed to provide the high levels of information that can be gained when using remotely-sensed data. This was due to the fact that many studies had not had access to digitally processed data, only photographic products. This can provide more information from remotely-sensed imagery than the photographic (optical) products of computer-aided techniques.
Ideally, biomass resource assessment is undertaken using remotely-sensed data combined with ground verification and calibration. In this project, biomass classes identified from remotely sensed data were verified initially with the use of secondary data sources such as natural resource reports and maps. This sometimes hampered effective analysis because of problems related to data quality, differences in levels of ground data between biomass classes (in some instances there was no data at all), interpretation of different types of data, and ground location. Therefore, the level of interpretation was variable and subsequent field verification of key areas was undertaken to check ground interpretations and collect growing stock data. This fieldwork was undertaken in Malawi, Swaziland and Zimbabwe during August 1986.
REMOTE SENSING
Satellite remote sensing is the technique of acquiring data (imagery) about the earth surfaces and atmosphere from satellites. Sensors on board satellites provide data at a synoptic scale from a single data-take, thereby making the analysis of remotely-sensed data a cost-effective tool for resource assessment over large areas. A further advantage of satellite data is that repeat imagery for any scene can usually be acquired. The repeat period between data-takes varies from relatively short periods of less than 24 hours on meteorological satellites to between 16 and 26 days on earth resource satellites. These figures represent the shortest repeat times and, due to a variety of technical and logistical reasons, when using earth resource satellites the repeat periods can be much longer. The capability to provide time-sequential data is, however, of great importance in both resource assessment and monitoring changes in the resource base.
Sensors for the acquisition of remotely-sensed data are found on various types of satellites which can be divided into two groups:
i) earth resources satellites (e.g., the American Landsat series and the French SPOT satellite); and
ii) meteorological satellites (e.g., the NOAA series and METEOSAT).
Data are provided to the user either as photographic (optical) products or computer compatible tapes (CCTs). The latter format is more useful for resource assessment as the data can be digitally processed and the maximum amount of information can be extracted from an image. This, however, can only be carried out effectively using computerized digital image-processing systems.
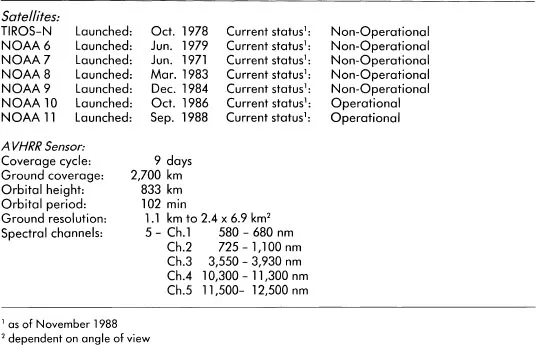
The data used in this work were acquired by the Advanced Very High Resolution Radiometer (AVHRR). This sensor is carried on board the American NOAA meteorological satellites, in this case NOAA-7, and the data were supplied on CCTs from NASA. The salient characteristics of this satellite and sensor combination have been detailed by Kidwell (1984) and Justice (1986) and its main characteristics are outlined in Table 1.1.
Table 1.1 CHARACTERISTICS AND STATUS OF NOAA WEATHER SATELLITES AND THE AVHRR SENSOR
REGIONAL BIOMASS ASSESSMENT
Role of regional biomass assessment in the SADCC Fuelwood Project
Regional biomass assessment was a fundamental aspect of the entire project as it provided the main supply parameters for energy-balance modelling and budgeting in the SADCC region and of the individual member states. Information relating to the areal distri¬bution, quantity, and quality of fuelwood was provided at three levels:
i) the SADCC region;
ii) individual member states; and
iii) individual administrative units in each member state.
This information enabled both the quantity and quality of woody biomass and its areal distribution to be assessed. It involved two parts: first, the identification and mapping of biomass classes; and secondly, the construction of a woody biomass database of biomass class areas, growing stocks, and mean annual increments (MAIs).
Identification and mapping of biomass classes
This component of the work was undertaken in three phases:
| i) | Phase I: | Inspection and preprocessing of AVHRR data; |
| ii) | Phase 11: | Initial image interpretation and mapping of vegetation classes, derivation of temporal data plots, and training statistics; and |
| ii) | Phase 111: | Automatic classification of biomass classes. |
AVHRR Data
Data are acquired for any part of the earth’s surface by the AVHRR sensor on board each NOAA satellite. These data are aimed primarily at the meteorological community and are taken every 12 hours. Therefore, every alternate data-take is at night and is of limited use in the context of biomass assessment. However, at the equator, the daylight pass for NOAA 7 and 9 satellites was 14.30 hours (local time) and on NOAA 6,8, and 10, it was 07.30 hours (local time). Because of the short repeat-period between data-takes, there is a very high probability that in any weekly period, a ground resolution element (the smallest area on the ground that can be resolved on the imagery) will be cloud-free during data acquisition and the reflectance of the land-cover sensed rather than that of the cloud-top.
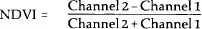
Because of this ability to acquire information about the land surface, the potential of AVHRR data in a wide variety of ecologically-based studies has become apparent in recent years (Gatlin et al., 1983; Norwine & Greegor, 1983; Schneider et al., 1981; Tarpley et al., 1984; Townshend & Tucker, 1984; Tucker et al., 1983, 1984a, 1984b, 1985a, 1985b). The configuration of the AVHRR sensors, particularly the wavelengths of the sensors in Channels 1 and 2 (red and near infra-red respectively), means that when cloud-free situations occur, useful ecological information can be obtained from within the ground resolution elements. The data from these two channels are combined for each ground resolution element and an index of vegetation status is calculated. This is called the Normalized Difference Vegetation Index (NDVI) and it is calculated by the following equation.
The nominal resolution of the AVHRR sensor is 1.1 km, although a variety of operational raw data products from this base resolution up to 25 km have been produced by NOAA (Kidwell, 1984). NOAA have for certain years produced Global Vegetation Index (GVI) data on a weekly basis; being a sub-sampled temporally composited NDVI product that covers most parts of the globe on a polar stereographic projection with a nominal resolution of 20 km.
Although such data have been used for land...