![]()
Contents
CHAPTER 1 ▪ History of Baseball
CHAPTER 2 ▪ Career Trajectories
CHAPTER 3 ▪ Runs expectancy
CHAPTER 4 ▪ The count
CHAPTER 5 ▪ PITCHf/x Data
CHAPTER 6 ▪ Batted Balls
CHAPTER 7 ▪ Plate Discipline
CHAPTER 8 ▪ Probability and Modeling
CHAPTER 9 ▪ Streakiness and Clutch Play
Bibliography
Index
![]()
CHAPTER 1
History of Baseball
INTRODUCTION
Professional baseball in the United States has a long history, as both the American and National Leagues have played since the 1901 season. Baseball from the beginning collected statistics, so most of the basic statistics such as counts of at-bats, hits, runs, home runs, strikeouts, and walks are available for all players since 1901. In this chapter graphs are used to explore patterns of rates of these basic statistics over time – these patterns help us learn about the history of baseball. The first part of this chapter focuses on team offensive statistics such as the number of runs or home runs hit by a team in a baseball game. Baseball is a competition between the offensive team and defense team and these plots show that the balance of this competition has drifted between the offense and the defense over baseball history. For example, we will learn that strikeouts per game are currently at an all-time high suggesting that pitchers currently have an advantage in modern baseball.
Since there is much interest in leaders in different statistical categories, the second part of the chapter focuses on the patterns of the leaders for different baseball measures. Graphs will be used to look at the leading batting averages, home runs, and on-base percentages. By focusing on the unusually high leading performances, one is introduced to some of the greatest players in baseball history.
TEAM STATISTICS
Runs scored
A baseball team wins a game by scoring more runs than its opponent. One interesting aspect of baseball from a historical perspective is that the basic rules have not changed. A game is divided into nine innings, where each team has the opportunity to score runs. In a half-inning, players come to bat according to a prescribed batting lineup, and batters continue to come up until three outs are recorded.
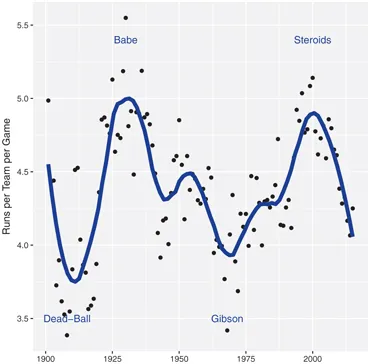
Since runs are such a fundamental component of baseball, a good place to start is to explore the history of scoring runs. Figure 1.1 displays a time series plot of the average number of runs scored by a team in a game for each season from 1901 through 2015. The blue line is a smoothing curve that helps one see the basic patterns of growth and decline of run scoring.
Generally, one sees from the graph that teams tend to average between 3.5 and 5.5 runs a game, but there are dramatic changes in run scoring over the history of baseball. Labels are used to highlight four seasons 1908, 1930, 1968, and 2000 that were unusual with respect to run scoring.
- In the so-called Dead-Ball era (from about 1900 through 1920) in baseball, it was challenging to score runs. Games were held in spacious ballparks and the ball was “dead”, partly by design and partly by overuse. The low season for scoring runs in this period was 1908. The batting average for all players that season was only 0.239 (contrasted to 0.255 in the 2016 season) and the Earned Run Average (ERA) for all pitchers was a low 2.37, contrasted with an ERA of 4.18 in the 2016 season. There were a number of dominant starting pitchers during this era including Addie Joss, Christy Mathewson, Cy Young, and Mordecai Brown.
- Run scoring dramatically increased after the Dead-Ball era, hitting a peak in 1930 when over 5.5 runs were scored on average by a team each game. The 1930 season is labeled in the figure with “Babe” as the dominant offensive player. Dominant hitters during this period included Babe Ruth, Lou Gehrig, Mel Ott, Al Simmons, and Chuck Klein. The 1927 New York Yankees, the “Murderer’s Row”, was arguably the most famous team during this period including Ruth and Gehrig. In contrast to the 1908 season, the average AVG in 1930 was a robust 0.296, and the average ERA was a high 4.81.
- After the Babe Ruth period, run scoring generally decreased from 1930 through 1968, although there was a modest increase in scoring from 1945 to 1955. The season 1968 was remarkable when only 3.4 runs were scored by a team in a game. This season was called the “year of the pitcher” and several pitchers had notable accomplishments. This season is labeled by “Gibson” since Bob Gibson had a remarkable low season ERA of 1.12 and Denny McClain won 31 regular season games. Carl Yastrzemski won the American League batting crown with a mere 0.301 batting average. After the 1968 season, the Rules Committee of Major League Base ball made several rule changes to allow for more offense. The strike zone was changed to the zone used before 1963 and the height of the pitching mound was lowered from 15 to 10 inches.
- Since the 1968 season, there was a steady increase in run scoring until the 2000 season. From the graph, we see the average runs scored by a team in the 2000 season was sim ilar to the peak around the 1930 season. The 2000 season represented the period of time, the so-called “Steroids Era” when a number of players were believed to use performance enhancing drugs. The top offensive players in the 2000 season were Todd Helton, Jason Giambi, Barry Bonds, and Alex Rodriguez.
- Since 2000, run scoring has dropped substantially, approach ing 4 runs per team per game. It appears that baseball is again in an era similar to the Dead-Ball era that is domi nated by pitching.
Home runs
One of the dramatic ways of scoring runs is through home runs. Figure 1.2 displays a graph of the average number of home runs per team per game over the history of Major League Baseball. Although home runs directly produce runs, by comparing Figure 1.1 and 1.2, one sees that the historical pattern of home run hitting differs from the general historical pattern of scoring runs.
- Generally, there was a general growth in home run hitting over the period from 1901 through 2017.
- Looking closer, we see three time intervals when there was steady growth in home run hitting 1905–1940, 1945–1962, and 1975–2000. Also we notice two intervals when there was a decrease in home run hitting 1962–1975, and 2000–2015.
- The three periods of home run increase can be identified with great home run players. The growth of home runs in the 1920s and 1930s can be connected with the great hitter Babe Ruth. To illustrate the dominance of “The Great Bambino,” during 1920 Ruth hit 54 out of a total of 630 home runs hit during that season.
The growth in home run hitting between 1945 and 1962 peaked with great seasons of the home run hitters Mickey Mantle and Roger Maris. During the 1961 season, Mantle and Maris had a great dual to break Ruth’s single-season record of 60 home runs. Maris did break Ruth’s record with 61 home runs, a record that lasted for 36 seasons, but this record was believed not to be legitimate by the baseball com missioner since he played more games in the 1961 season...