- 116 pages
- English
- ePUB (mobile friendly)
- Available on iOS & Android
eBook - ePub
The Economic Value of Water
About this book
Gibbons examines the water supply problem through five case studies. The problems faced by these regions and the methods suggested to overcome them provide excellent models for the entire United States. The case studies---typically, expanding supplies---but economic efficiency principles lead to emphasizing managing the demand. In many cases, this means reducing demand by raising prices.
Trusted by 375,005 students
Access to over 1.5 million titles for a fair monthly price.
Study more efficiently using our study tools.
Information
one
Municipalities
Consumptive use of water for municipal purposes is less than 10 percent of total water consumption in the United States, although it is often perceived as the most vital or important water use. From region to region the share of consumptive water use by municipalities varies widely, from less than 1 percent in rural states having irrigated agriculture (such as Idaho or Nebraska) to more than 50 percent in such urbanized states as New Jersey (53 percent) or New York (64 percent). In absolute numbers, the quantity of water consumed is greatest in the most populous states and in states where the climate is quite arid or hot. In 1980 the most municipal water was consumed in California (1,700 million gallons per day). New York (380 mgd), Arizona (340 mgd), and Florida (330 mgd). Consumptive water use is generally about 25 percent of withdrawals for municipal use.1
Municipal water demand encompasses a number of distinctly different kinds of water use. For descriptive purposes these can be categorized as residential, public, and "other" uses. Residential (household) water use is both for indoor purposes such as bathing, drinking, or cooking, and for outdoor purposes such as watering lawns, washing cars, or filling swimming pools. Figure 1–1 shows the breakdown of per capita residential use into its constituent parts. Public water use includes firefighting and maintenance of public buildings and grounds. Also supplied in part by public water utilities, and thus included in some municipal water use data, are commercial and industrial uses in stores, restaurants, small business establishments, and some factories. Some statistical analyses of the municipal water use sector include total municipal demand, while other analyses focus solely on residential water demand. In most
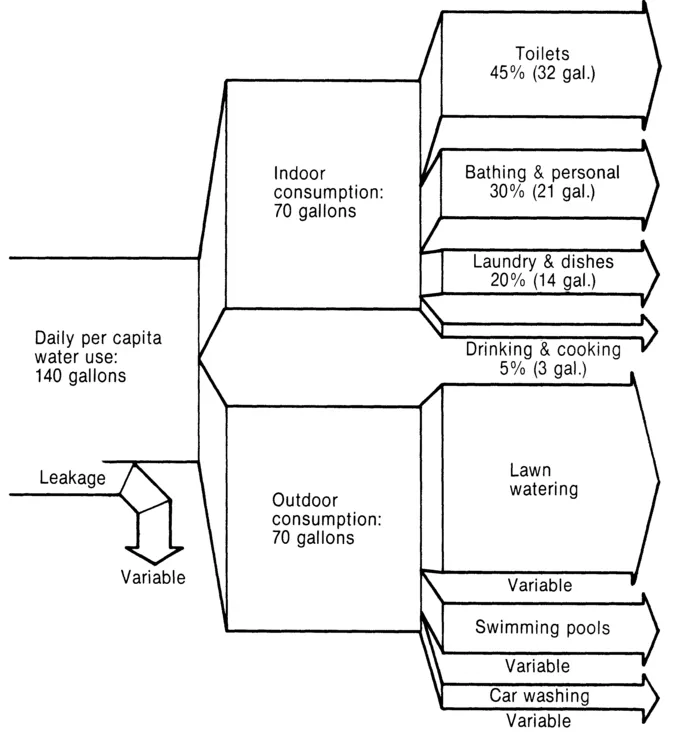
Figure 1–1. A picture of residential water use Source: Murray Milne, Residential Water Reuse, California Water Resources Center Report no. 46 (Davis Calif., University of California, 1979) p.9. reprinted with permission of the publisher.
localities, household use comprises the largest fraction of municipal water use.
Municipal water demand is influenced by several factors, such as climate, population density, income, and water price. Within the span of a year, consumption exhibits a marked seasonal pattern. In the summer months water use for outdoor purposes and air conditioning may cause average daily consumption to rise to more than double the daily winter average. This pattern is almost everywhere in evidence where the climate is seasonal, and particularly so where the summers are very hot and dry. Weather is also an indicator of the annual level of water demand. In cooler climates, the growing season for lawns and gardens is shorter than in warm climates, and air conditioning is not as imperative ar as heavily used.
The number of residents per household and household income level are also important determinants of municipal water demand. The more people per water meter, and the more water-using amenities they can afford (such as swimming pools and automatic dishwashers), the greater the household demand. When a community has a relatively high per capita income level, there are usually more commercial establishments per resident and more water-using public facilities such as golf courses. When the density of households is great—in other words, when the dwelling unit is a high-rise apartment building rather than a single-family house—there is less water consumption for outdoor uses per household. Finally, despite persistent lore to the contrary, the level of municipal water demand is somewhat responsive to water price. Price elasticity is the subject of the following section.
Price Elasticity of Municipal Water Demand
Municipal or residential water demand functions tor numerous localities have been estimated; based on a variety of data, these have produced a wealth of price elasticity estimates. Some studies have concentrated on seasonal demand, some on the regional differences in demands, and still others have addressed special issues in modeling municipal water demand, such as the choice of price variable or the relative merits of cross-sectional and time-series analyses.
One of the earliest residential water demand analyses to produce price elasticity estimates was done by Howe and Linaweaver in 1967; it covered a cross section of the entire country.2 Most previous studies had concentrated on projections of water requirements, and gave little attention to the effect of price on demand. Howe and Linaweaver derived different price and income elasticities for the East and the West, for winter and summer use, and for type of service (public versus private sewers). Their results indicate that in-house water use is consistently price-inelastic (−0.23), while so-called sprinkling use is more elastic and differs significantly between the East (−1.6) and the West (−0.7). Table 1–1 gives the range of price elasticities in the literature.
More recently, Grima (1972) and Danielson (1977) confirmed that summer and winter elasticities can differ significantly. Using time-series data of household water use in Raleigh, North Carolina, Danielson found that winter demand is inelastic (− 0.305), while summer demand exhibits greater price sensitivity (−1.38).3 Grima evaluated cross-sectional residential data from the Toronto area of Ontario, Canada, again indicating an inelastic winter demand (− 0.75) and an elastic summer demand (−1.07).4
Many studies of municipal water demand ignore the seasonal variation in elasticity but concentrate on the regional variation. Foster and Beattie used 1960 data from 218 cities across the country to estimate municipal demand equations for six regions of the United States.5 Their results indicate that overall price elasticities vary across regions, with the more elastic demand in regions where outdoor use comprises a larger fraction of total use. The average elasticity for the eastern half of the country ( − 0.37) is less than the elasticity for the more arid western half of the country ( − 0.54) (see figure 1–2). The authors conjecture that the slightly less elastic nature of the demand in the Southwest, despite the arid climate, is a result in part of the large proportion of residents with low per capita income. The higher level of household consumption in the Southwest is a result of the higher average number of residents per water meter.
Several other cross-sectional municipal water demand studies provide elasticity estimates for particular locales. The price elasticity of municipal water demand calculated from data on thirteen Georgia towns was
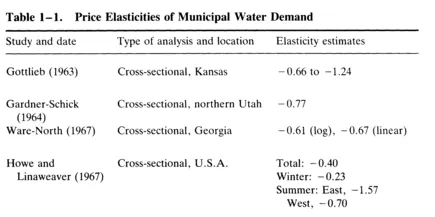
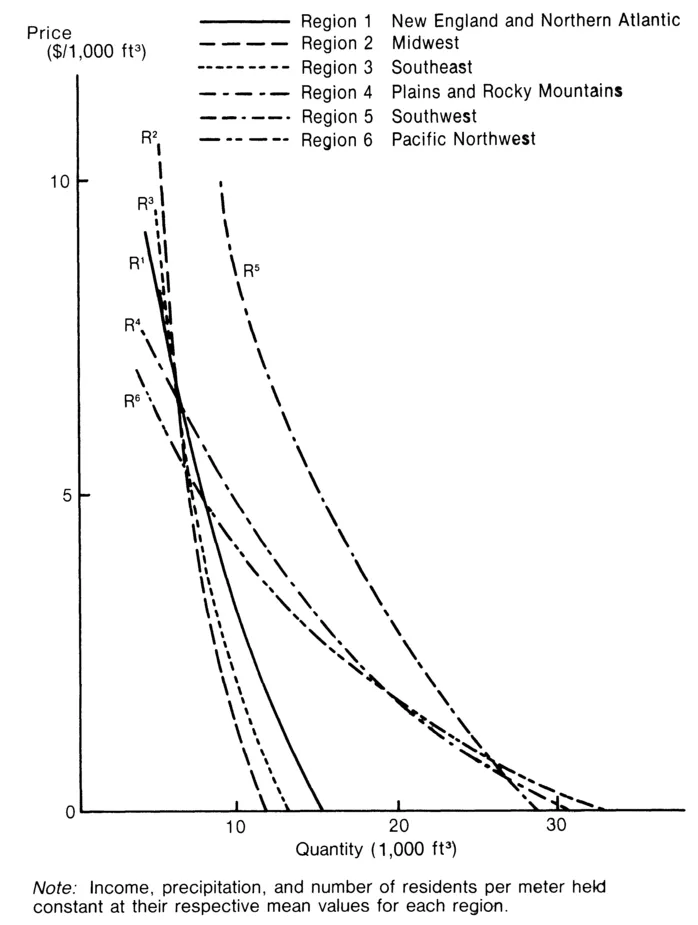
Figure 1–2. Estimated regional water demand functions Source: Henry S. Foster, Jr. and Bruce R. Beattie, "Urban Residential Demand for Water in the United States," Land Economics vol. 55, no. 1; reprinted with permission of the University of Wisconsin Press, publisher.
found to be − 0.61; in nineteen Massachusetts towns the elasticity was − 0.32; in forty-three northern Utah towns the elasticity was − 0.77; and in Kansas the elasticity was −0.68.6 Each case was an attempt to isolate the price effect by studying a relatively homogeneous set of towns. The data for each study presumably reflect towns with similar socioeconomic profiles, weather patterns, and residential, commercial, and industrial shares of total water use.
The literature on municipal water demand contains a number of studies designed to illuminate specific issues that arise in modeling demand. One of the first attempts at time-series analysis was done on data from Boulder, Colorado in 1970.7 Although the price change examined was only a single shift from flat-rate to metered pricing (no elasticities were estimated), consumption showed a sudden drop in response. The relative merits of cross-sectional versus time-series data were specifically addressed in a 1972 study of Chicago and environs.8 Both a time-series analysis of data from 1951 to 1961 for Chicago and suburbs and a cross-sectional analysis of data from 103 northeastern Illinois communities were included for comparison. The time-series results (price elasticity for Chicago, − 0.02, and for the suburbs, − 0.28) were much less elastic than the cross-sectional results (ranging from − 0.26 to − 0.82). These findings indicate that the assumptions underlying either cross-sectional or time-series demand analyses may have been violated. The spatial effects of price and other variables may not mirror the temporal effects, and there may have been shifts in individual demand curves over time. Also, in the time-series analysis the price shifts may not have been large enough for the estimation of realistic and dependable price elasticities. For Chicago, the nominal price range over the ten years of data was only from 8 cents (1951) to 22 cents (1961) per thousand gallons. The minuscule price elasticity for Chicago in the time-series analysis may be the result of relatively low absolute prices (as compared to the price range in the communities of 25 cents to $1.25 in 1961), in addition to the almost insignificant change over the span of the data.
In another time-series study, an analysis of twenty-six years of water utility production data from Tucson, Arizona revealed elasticities of water demand which shifted between the period 1946–1964 (− 0.62) and the period 1965–1971 (− 0.41).9 The drop in elasticity indicates that an underlying factor of municipal water demand changed over time Various reasons for the shift given in the paper include the coincidence of a sudden, major price increase and movement to a lower, less elastic level of consumption; rising incomes (the water bill became a smaller part of household expenditure); and a shift in the mix of users to those less responsive to price.
One controversy which has received a great deal of attention in the literature surrounds the choice of price variable. Billings and Agthe, in a 1980 paper, maintained that when water is priced in a block-rate structure, the use of average price rather than marginal price could cause the identification of a spurious demand function.10 Their argument, and debates in the water demand literature, parallel discussions in the body of work on the estimation of ...
Table of contents
- Cover
- Title
- Copyright
- Contents
- Foreword by Kenneth D. Frederick
- Acknowledgments
- Introduction
- 1. MUNICIPALITIES
- 2. IRRIGATION
- 3. INDUSTRY
- 4. WASTE ASSIMILATION
- 5. RECREATION AND ESTHETICS
- 6. NAVIGATION
- 7. HYDROPOWER
- EPILOGUE
Frequently asked questions
Yes, you can cancel anytime from the Subscription tab in your account settings on the Perlego website. Your subscription will stay active until the end of your current billing period. Learn how to cancel your subscription
No, books cannot be downloaded as external files, such as PDFs, for use outside of Perlego. However, you can download books within the Perlego app for offline reading on mobile or tablet. Learn how to download books offline
Perlego offers two plans: Essential and Complete
- Essential is ideal for learners and professionals who enjoy exploring a wide range of subjects. Access the Essential Library with 800,000+ trusted titles and best-sellers across business, personal growth, and the humanities. Includes unlimited reading time and Standard Read Aloud voice.
- Complete: Perfect for advanced learners and researchers needing full, unrestricted access. Unlock 1.5M+ books across hundreds of subjects, including academic and specialized titles. The Complete Plan also includes advanced features like Premium Read Aloud and Research Assistant.
We are an online textbook subscription service, where you can get access to an entire online library for less than the price of a single book per month. With over 1.5 million books across 990+ topics, we’ve got you covered! Learn about our mission
Look out for the read-aloud symbol on your next book to see if you can listen to it. The read-aloud tool reads text aloud for you, highlighting the text as it is being read. You can pause it, speed it up and slow it down. Learn more about Read Aloud
Yes! You can use the Perlego app on both iOS and Android devices to read anytime, anywhere — even offline. Perfect for commutes or when you’re on the go.
Please note we cannot support devices running on iOS 13 and Android 7 or earlier. Learn more about using the app
Please note we cannot support devices running on iOS 13 and Android 7 or earlier. Learn more about using the app
Yes, you can access The Economic Value of Water by Diana C. Gibbons in PDF and/or ePUB format, as well as other popular books in Economics & Environmental Economics. We have over 1.5 million books available in our catalogue for you to explore.