eBook - ePub
Classification and Regression Trees
- 368 pages
- English
- ePUB (mobile friendly)
- Available on iOS & Android
eBook - ePub
Classification and Regression Trees
About this book
The methodology used to construct tree structured rules is the focus of this monograph. Unlike many other statistical procedures, which moved from pencil and paper to calculators, this text's use of trees was unthinkable before computers. Both the practical and theoretical sides have been developed in the authors' study of tree methods. Classification and Regression Trees reflects these two sides, covering the use of trees as a data analysis method, and in a more mathematical framework, proving some of their fundamental properties.
Trusted by 375,005 students
Access to over 1 million titles for a fair monthly price.
Study more efficiently using our study tools.
Information
Print ISBN
9781138469525
Subtopic
Probability & Statistics1
BACKGROUND
At the University of California, San Diego Medical Center, when a heart attack patient is admitted, 19 variables are measured during the first 24 hours. These include blood pressure, age, and 17 other ordered and binary variables summarizing the medical symptoms considered as important indicators of the patient’s condition.
The goal of a recent medical study (see Chapter 6) was the development of a method to identify high risk patients (those who will not survive at least 30 days) on the basis of the initial 24-hour data.
Figure 1.1 is a picture of the tree structured classification rule that was produced in the study. The letter F means not high risk; G means high risk.
This rule classifies incoming patients as F or G depending on the yes-no answers to at most three questions. Its simplicity raises the suspicion that standard statistical classification methods may give classification rules that are more accurate. When these were tried, the rules produced were considerably more intricate, but less accurate.
The methodology used to construct tree structured rules is the major story of this monograph.
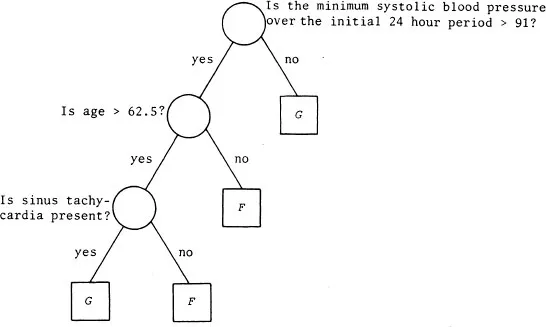
FIGURE 1.1
1.1 CLASSIFIERS AS PARTITIONS
The general classification problem is similar to the medical diagnosis problem sketched above. Measurements are made on some case or object. Based on these measurements, we then want to predict which class the case is in.
For instance, days in the Los Angeles basin are classified according to the ozone levels:
Class 1: nonalert (low ozone)
Class 2: first-stage alert (moderate ozone)
Class 3: second-stage alert (high ozone)
During the current day, measurements are made on many meteorological variables, such as temperature, humidity, upper atmospheric conditions, and on the current levels of a number of airborne pollutants. The purpose of a project funded by the California Air Resources Board (Zeldin and Cassmassi, 1978) was to explore methods for using the current-day measurements to predict the classification of the following day.
An EPA project had this goal: The exact analysis of a complex chemical compound into its atomic constituents is slow and costly. Measuring its mass spectra can be done quickly and at relatively low cost. Can the measured mass spectra be used to accurately predict whether, for example, the compound is in
class 1 (contains one or more chlorine atoms), or
class 2 (contains no chlorine)?
(See Chapter 7 for more discussion.)
In these problems, the goal is the same. Given a set of measurements on a case or object, find a systematic way of predicting what class it is in. In any problem, a classifier or a classification rule is a systematic way of predicting what class a case is in.
To give a more precise formulation, arrange the set of measurements on a case in a preassigned order; i.e., take the measurements to be x1, x2, .…, where, say, x1 is age, x2 is blood pressure, etc. Define the measurements (x1, x2, …) made on a case as the measurement vector x corresponding to the case. Take the measurement space to be defined as containing all possible measurement vectors.
For example, in the heart attack study, is a 19-dimensional space such that the first coordinate x1 (age) ranges, say, over all integer values from 0 to 200; the second coordinate, blood pressure, might be defined as continuously ranging from 50 to 150. There can be a number of different definitions of . What is important is that any definition of have the property that the measurement vector x corresponding to any case we may wish to classify b...
Table of contents
- Cover
- Half Title
- Title Page
- Copyright Page
- Dedication
- Table of Contents
- Preface
- Chapter 1 BACKGROUND
- Chapter 2 INTRODUCTION TO TREE CLASSIFICATION
- Chapter 3 RIGHT SIZED TREES AND HONEST ESTIMATES
- Chapter 4 SPLITTING RULES
- Chapter 5 STRENGTHENING AND INTERPRETING
- Chapter 6 MEDICAL DIAGNOSIS AND PROGNOSIS
- Chapter 7 MASS SPECTRA CLASSIFICATION
- Chapter 8 REGRESSION TREES
- Chapter 9 BAYES RULES AND PARTITIONS
- Chapter 10 OPTIMAL PRUNING
- Chapter 11 CONSTRUCTION OF TREES FROM A LEARNING SAMPLE
- Chapter 12 CONSISTENCY
- Bibliography
- Notation Index
- Subject Index
Frequently asked questions
Yes, you can cancel anytime from the Subscription tab in your account settings on the Perlego website. Your subscription will stay active until the end of your current billing period. Learn how to cancel your subscription
No, books cannot be downloaded as external files, such as PDFs, for use outside of Perlego. However, you can download books within the Perlego app for offline reading on mobile or tablet. Learn how to download books offline
Perlego offers two plans: Essential and Complete
- Essential is ideal for learners and professionals who enjoy exploring a wide range of subjects. Access the Essential Library with 800,000+ trusted titles and best-sellers across business, personal growth, and the humanities. Includes unlimited reading time and Standard Read Aloud voice.
- Complete: Perfect for advanced learners and researchers needing full, unrestricted access. Unlock 1.4M+ books across hundreds of subjects, including academic and specialized titles. The Complete Plan also includes advanced features like Premium Read Aloud and Research Assistant.
We are an online textbook subscription service, where you can get access to an entire online library for less than the price of a single book per month. With over 1 million books across 990+ topics, we’ve got you covered! Learn about our mission
Look out for the read-aloud symbol on your next book to see if you can listen to it. The read-aloud tool reads text aloud for you, highlighting the text as it is being read. You can pause it, speed it up and slow it down. Learn more about Read Aloud
Yes! You can use the Perlego app on both iOS and Android devices to read anytime, anywhere — even offline. Perfect for commutes or when you’re on the go.
Please note we cannot support devices running on iOS 13 and Android 7 or earlier. Learn more about using the app
Please note we cannot support devices running on iOS 13 and Android 7 or earlier. Learn more about using the app
Yes, you can access Classification and Regression Trees by Leo Breiman,Jerome Friedman,R.A. Olshen,Charles J. Stone in PDF and/or ePUB format. We have over one million books available in our catalogue for you to explore.