![]()
1
From Principles to Measurement
Theory-Based Tips on Writing Better Questions
Hart Blanton and James Jaccard
Self-reports are the dominant assessment method in the social sciences and a large part of their appeal is the ease with which questions can be generated and administered. In our view, however, this apparent ease obscures the care that is needed to produce questions that generate meaningful data. In this chapter, we introduce and review basic principles of measurement, which we then use as a foundation to offer specific advice (“tips”) on how to write more effective questions.
Principles of Measurement
A Measurement Model
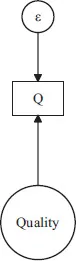
Suppose a researcher wanted to measure consumers’ judgments of the quality of a product. Perceptions of product quality cannot be observed directly—perceived quality is a latent, theoretical psychological construct, assumed to be continuous in character, such that it can only be inferred indirectly through observable actions. One such action can be ratings a consumer makes on a rating scale. Suppose consumers are asked to rate the perceived quality of a product on a scale that ranges from 0 (“very low quality”) to 6 (“very high quality”). By seeking to quantify product perceptions in this manner—and whether the researcher has realized it or not—a formal measurement model has been embraced. This model is depicted in Figure 1.1.
The rectangle labeled “Q” in Figure 1.1 represents the rating on the 0-to-6 scale. This rating does not, by fiat, reveal “true” quality perceptions of the respondent, which is conceptualized as an unobservable latent construct and represented in Figure 1.1 by the circle with the word “quality” in it. The researcher assumes that the observed “Q” is influenced by true, latent quality perceptions, but that the correspondence between latent and observed constructs is less than perfect. Ratings on Q are thus a function of both the consumers’ true evaluations and measurement error (represented as “ε” in Figure 1.1). This can be expressed algebraically in the form of a linear model:
Figure 1.1 Measurement Model
| | [1] |
where α is an intercept, λ is a regression coefficient (also frequently called a loading), and ε is measurement error. When the relationship is linear, as assumed in Equation 1, then Q is an interval-level measure of the latent construct of perceived quality. If the relationship is non-liner but monotonic, Q is an ordinal measure of the latent construct. Articulation of this formal model focuses attention on one of the primary challenges facing researchers who wish to create self-report questions—the need to reduce the influence of error on observed ratings. We next consider two sources of error, random and systematic, as well as their implications for characterizing the reliability and validity of self-report items.
Random Error and Reliability
Random error represents random influences, known or unknown, that arbitrarily bias numeric self-reports upward or downward. Often referred to as “noise,” random error can be generated by such factors as momentary distractions, fluke misunderstandings, transient moods, and so on. This form of error is commonplace, but its relative magnitude can vary considerably from one question to the next. As such, it is meaningful to think about the degree to which a given question or set of questions is susceptible to random error. This represents the concept of reliability.
The reliability of observed scores conveys the extent to which they are free of random error. Statistically, a reliability estimate communicates the percentage of variance in the observed scores that is due to unknown, random influences as opposed to systematic influences. Thus, if the reliability of a set of scores is 0.80, then 80% of their variation is systematic and 20% is random. The presence of random error in measures can bias statistical parameter estimates, potentially attenuating correlations and causing researchers to think they have sufficiently controlled for constructs in an analysis, when they have not.
Systematic Error and Validity
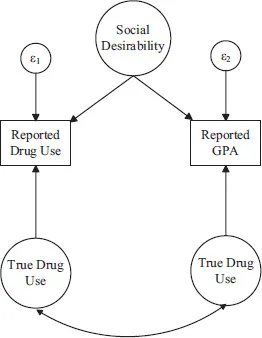
Another form of measurement error is called systematic error. This source of error often introduces variance into observed self-report items that is non-random; i.e., that is a function of one or more psychological constructs that are something different than the construct of interest. Consider the model in Figure 1.2. Here a researcher hopes to measure both drug use and grade-point average (GPA) via self-report. Each of these constructs are influenced by the true latent constructs that are of interest (as in Figure 1.2), but another latent construct is also exerting influence on the two measures, social desirability.
Figure 1.2 Example of Systematic Error
The dynamic in Figure 1.2 can arise if those most concerned with projecting a positive image are under reporting their true drug use and over reporting their true GPA. The systematic influence of this “third variable,” social desirability, might cause a researcher to overestimate (or underestimate) the strength of the relationship between drug use and academic performance.
Systematic error of the type in Figure 1.2 is a threat to the validity of a measure. Ratings on a self-report are valid to the extent that they accurately reflect the construct that is of interest, as opposed to constructs that are not of interest. In the above example, the two measures are partly influenced by the constructs that were of interest (drug use and GPA) but they also are partly influenced by a construct that was not (social desirability), and so the validity of these measures was undermined. In more extreme cases, a measure might be so strongly biased by systematic, confounding influences that it is best viewed as invalid; i.e., it should be viewed as a measure assessing something other than the construct of interest.
Statistical and Methodological Approaches to Measurement Error
One way of handling the presence of measurement error is to embrace modern analytic methods that can correct for biasing influences. Structural equation modeling (SEM) is a particularly useful analytic tool, well-suited to estimating statistical parameters while adjusting for both systematic and random sources of measurement error (Kline, 2016). Incorporated into these analytic approaches might also be attempts to formally measure known or anticipated sources of systematic error (“confounds”), so that their influences can be statistically controlled (or “covaried”). For instance, if a researcher has the concern that social desirability tendencies will influence ratings, a separate measure socially desirability can be administered (e.g., Fleming, 2012; Uziel, 2010), so that its influence on ratings can be formally estimated and statistically controlled during parameter estimation.
The Aggregation Approach to Measurement Error
A common approach to reducing the impact of random measurement error is aggregation. Because one can rarely expect to create a single perfect self-report item that captures all of the variance in a complex psychological construct, researchers often construct multi-item instruments to measure constructs. The logic of aggregation is that, even if a given item is influenced to a consequential degree by random error, different items will be influenced in different and largely idiosyncratic ways. The result is that when ratings on multiple items are summed or averaged, the error in specific items will “wash out” in the aggregate score, resulting in a more reliable and valid estimate of the latent construct of interest. This is a generally sound and accepted practice but there are common misperceptions and misapplications of aggregation. We explore these shortly, but we first consider the different types of constructs one might wish to assess, and how this might affect aggregation.
Defining the Construct of Interest
Broad versus Narrow Constructs
Some constructs are fairly concrete and easily referenced in self-report items (e.g., age, height, income). With such “narrow” constructs, there will often be little gained from constructing multiple items to represent them and then aggregating the questions because they will yield identical information about a respondent (e.g., “How old are you in years and months?” “How old are you in months?”). In contrast, many concepts that are of basic and applied interest in psychology are by their nature abstract and hard to translate into a single question (e.g., intelligence, depression, social support). With such “broad” or abstract constructs, aggregation can have value, as multiple questions give respondents imperfect but non-redundant ways of expressing their standing.
Breadth versus Dimensionality
A construct might be broad in multiple senses. One way is that it can take a myriad of roughly equivalent, interrelated forms, such that a larger number of items might capture more of distinct ways it can manifest itself, leading to improved measurement. Consider extraversion. Highly extraverted people might evidence this quality by seeking to interact with new people, by seeking to have many friends, through their comfort speaking in groups, by their willingness to tell jokes, and so on. Our understanding of this construct is simply too big to be captured by any single item. That said, extraversion needn’t necessarily be expressed by any one of these specific behaviors. Some extraverts are known for their joy of speaking in public and others for their love of telling jokes. When aggregating across these and many other distinct expressions, a general tendency to be extraverted can emerge in an aggregate scale total, resulting in a meaningful unitary score that captures relative standing on this broad dimension.
A second way in which a construct might be broad is that it might be multidimensional, in that it is made up of interrelated but distinct facets. As examples, the construct of depression is often thought to be represented by four different (and also broad) facets: a cognitive dimension, an affective dimension, a somatic dimension, and an apathy dimension. Anxiety is thought to have three facets: social anxiety, generalized anxiety, and panic-related anxiety. Social support is thought to have three facets: tangible support, emotional support, and informational support.
To measure a broad construct, it is thus incumbent on researchers to clearly define it, specifying its dimensional structure based on theory or on past research. In the case of extraversion, where a researcher assumes a broad but unidimensional attribute, the goal in generating items will be to approximate a selection of items, drawn from a theoretical and infinitely large pool of equally good items, each of which is influenced by a person’s true extraversion (in a manner consistent with Equation 1). In contrast, in the case of depression, the goal will be to first define four facets of depression, and to repeat this same process of item generation four different times. In truth, whether pursuing items to capture a broad unidimensional construct or multiple broad dimensions of a multidimensional construct, some items will almost assuredly be better than others (as expressed by the relative size of λ and ε in Equation 1). However, through the creation of multiple imperfect items that vary in their quality, the resulting aggregate score can produce an observed estimate that is far better than can be generated by the pursuit of the single “best” self-report item.
An Iterative Process
How successful one will be at generating sets of questions that combine to estimate a broad construct should be viewed as an empirical question, one that often can be evaluated through reference to the results of analyses performed on the test items themselves. It is beyond the scope ...