eBook - ePub
Understanding Multivariate Research
A Primer For Beginning Social Scientists
- 104 pages
- English
- ePUB (mobile friendly)
- Available on iOS & Android
eBook - ePub
Understanding Multivariate Research
A Primer For Beginning Social Scientists
About this book
Although nearly all major social science departments offer graduate students training in quantitative methods, the typical sequencing of topics generally delays training in regression analysis and other multivariate techniques until a student's second year. William Berry and Mitchell Sanders's Understanding Multivariate Research fills this gap with a concise introduction to regression analysis and other multivariate techniques. Their book is designed to give new graduate students a grasp of multivariate analysis sufficient to understand the basic elements of research relying on such analysis that they must read prior to their formal training in quantitative methods. Berry and Sanders effectively cover the techniques seen most commonly in social science journals--regression (including nonlinear and interactive models), logit, probit, and causal models/path analysis. The authors draw on illustrations from across the social sciences, including political science, sociology, marketing and higher education. All topics are developed without relying on the mathematical language of probability theory and statistical inference. Readers are assumed to have no background in descriptive or inferential statistics, and this makes the book highly accessible to students with no prior graduate course work.
Trusted by 375,005 students
Access to over 1.5 million titles for a fair monthly price.
Study more efficiently using our study tools.
Information
1
Introduction
The Concept of Causation
Much social science research is designed to test hypotheses (or propositions) about causation. Such hypotheses take the form of an assertion that if something (e.g., some event) occurs, then something else will happen as a result. Among nations, we might assert that population growth causes (or influences) economic growth. Among individuals, we might believe that body weight is influenced by food consumption. In a causal hypothesis, the phenomenon that is explained is called the dependent variable. It is called a variable because we are conceiving of something that can “vary” across a set of cases (e.g., persons or nations); it is called dependent because of the assertion of causation: its value is hypothesized to be dependent on the value of some other variable. In our examples the dependent variables are a nation’s economic growth and an individual’s weight. The other variable in the hypothesis—the one that is expected to influence the dependent variable—is called the independent (or explanatory) variable. Population growth is thought to be an independent variable affecting a nation’s economic growth; a person’s food consumption is conceived as an independent variable influencing his or her weight. There are numerous synonyms for the terms independent and dependent variable in the social sciences. Table 1.1 lists the most common terms.
Let us take a closer look at what it means to claim that one variable influences another. The most common conception of causation focuses on the responsiveness of one variable to a change in the value of the other. When we claim that food intake influences body weight, we are implicitly arguing that if we were able to increase a person’s food consumption while holding everything else constant, the individual’s weight will change. The clause “while holding everything else constant” is important, because if other variables change at the same time as food consumption, the individual’s weight change could be a response to a change in one or more other factors rather than the increase in food consumption.
TABLE 1.1 Synonyms for Independent and Dependent Variable
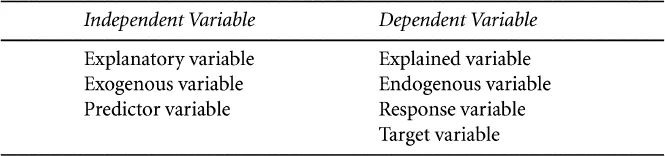
SOURCE: Modified from Maddala (1992,61).
More generally, when we claim that some variable, X, influences another variable, Y, we mean that if all other variables could be held constant, then a change in the value of X would result in a change in the value of Y. We can also develop a measure of the magnitude (or strength) of the impact of X on Y by focusing on the size of the change in the value of Y occurring in response to some fixed increase in X. If a given increase in X leads to a 10-unit decrease in Y in one environment, but to a 5-unit decrease in another context, the former impact can be deemed twice as strong as the latter. (Several expressions are used interchangeably by social scientists to convey an assertion of causation; “X causes Y,” “X influences Y,” “X affects Y,” and “X has an impact on Y” are synonymous. The custom of using the symbol Y to denote a dependent variable and X to indicate an independent variable is deeply ingrained in the social science literature, and we shall follow this custom throughout the book.)
Experimental Research
Suppose we wish to test the hypothesis that an independent variable X influences a dependent variable Y using empirical analysis. (Empirical analysis refers to analysis based on observation.) The ideal way to do so would be to conduct an experiment. Your familiarity with experiments probably dates back to your first science class in elementary school. However, it is important to refresh our memories on the specific features of an experiment. To illustrate, say we design an experiment to test the claim that a fictitious new drug—a pill called Mirapill—helps to prevent children from getting the fictitious disease turkey pox. The population in question—that is, the cases to which the hypothesis is meant to apply—is children who have not had turkey pox. The independent variable is whether or not a child is given Mirapill, and the dependent variable is the probability that the child will get the disease.
In an experiment designed to test whether Mirapill reduces the probability of getting turkey pox, we would begin by taking a random sample—perhaps 1,000 subjects—from the population of children who have never had turkey pox. (For the sample to be random, every member of the population must have the same chance of being included in the sample.) These 1,000 children then would be randomly assigned to two groups. One group of 500 would be called the experimental group, and the other, the control group.
Randomness—both in the selection of subjects from the population and in the assignment of subjects to the experimental and control groups—is critical to the validity of an experiment. Statisticians have discovered that if a sample is selected randomly and is large enough (1,000 is certainly sufficient), it is likely to be representative, in every respect, of the larger population from which it is drawn.1 This means that we can learn almost as much by observing the sample as by observing the full population, yet the former is generally far less expensive and time consuming. In an experiment, we observe the random sample and, on the basis of what we learn, draw an inference about whether the hypothesis is likely to be true in the overall population. Similarly, random assignment of the children in the sample to the two groups makes it very likely that the groups will be nearly equivalent in every way For example, the two groups of children should be almost equally likely to be genetically predisposed to get turkey pox. The two groups also should be nearly equally likely to be exposed to turkey pox through contact with other children.
In the next step of the experiment, the children in the experimental group would be given Mirapill, whereas those in the control group would receive a placebo. (A good placebo would be a pill that looks exactly like Mirapill but contains no medicine.) After the pills are administered, both groups would be observed for a period, and we would determine how many children in each group contracted turkey pox. If fewer children in the experimental group than in the control group got the illness, this would be evidence supporting the hypothesis that Mirapill helps to prevent turkey pox. Furthermore, the difference between the two groups in the number of children contracting the disease would serve as a measure of the strength of Mirapill’s impact as a preventive. If many fewer children in the experimental group got sick, this would suggest that Mirapill has a strong effect. If only slightly fewer experimental group children came down with turkey pox, this would mean that the effect is probably weak.
Suppose we conduct this experiment and find that the incidence of turkey pox is substantially lower in the experimental group. Why would this be convincing evidence that Mirapill prevents turkey pox? To see why, recall what we mean when we say that X causes Y: if all other variables were held constant, then a change in the value of X would lead to a change in the value of Y. Our experiment gives us just the information we need to assess a claim of causation. We find out what happens to the dependent variable (the probability of getting turkey pox) when we change the value of the independent variable (receiving or not receiving Mirapill) when all other variables are held constant. (Saying that the experimental and control groups are nearly equivalent in every way—as a consequence of random assignment of children to the two groups—is the same as saying that all variables are held nearly constant from one group to the other.) In other words, random assignment of children to the control and experimental groups eliminates all explanations other than Mirapill for the difference in disease incidence between the two groups. For instance, a difference between the two groups in genetic susceptibility to turkey pox is unlikely to be responsible for the difference in disease incidence, because randomness of assignment makes it likely that varying degrees of genetic susceptibility are distributed evenly between the two groups, and thus likely that the two groups are similarly predisposed to getting turkey pox. Also, the fact that both groups were given some pill—either Mirapill or a placebo—allows us to reject the mere taking of some pill as a possible cause of the lower incidence of turkey pox in the experimental group.
The Logic Underlying Regression Analysis
Consider the hypothesis that food intake influences body weight. In principle, we could test this hypothesis experimentally, by randomly selecting subjects from the population of adults and then randomly assigning different levels of food inta...
Table of contents
- Cover
- Half Title
- Title Page
- Copyright Page
- Contents
- List of Tables and Figures
- Preface for Teachers and Students
- Acknowledgments
- 1 Introduction
- 2 The Bivariate Regression Model
- 3 The Multivariate Regression Model
- 4 Evaluating Regression Results
- 5 Some Illustrations of Multiple Regression
- 6 Advanced Topics
- 7 Conclusion
- Glossary
- References
- Index
Frequently asked questions
Yes, you can cancel anytime from the Subscription tab in your account settings on the Perlego website. Your subscription will stay active until the end of your current billing period. Learn how to cancel your subscription
No, books cannot be downloaded as external files, such as PDFs, for use outside of Perlego. However, you can download books within the Perlego app for offline reading on mobile or tablet. Learn how to download books offline
Perlego offers two plans: Essential and Complete
- Essential is ideal for learners and professionals who enjoy exploring a wide range of subjects. Access the Essential Library with 800,000+ trusted titles and best-sellers across business, personal growth, and the humanities. Includes unlimited reading time and Standard Read Aloud voice.
- Complete: Perfect for advanced learners and researchers needing full, unrestricted access. Unlock 1.5M+ books across hundreds of subjects, including academic and specialized titles. The Complete Plan also includes advanced features like Premium Read Aloud and Research Assistant.
We are an online textbook subscription service, where you can get access to an entire online library for less than the price of a single book per month. With over 1.5 million books across 990+ topics, we’ve got you covered! Learn about our mission
Look out for the read-aloud symbol on your next book to see if you can listen to it. The read-aloud tool reads text aloud for you, highlighting the text as it is being read. You can pause it, speed it up and slow it down. Learn more about Read Aloud
Yes! You can use the Perlego app on both iOS and Android devices to read anytime, anywhere — even offline. Perfect for commutes or when you’re on the go.
Please note we cannot support devices running on iOS 13 and Android 7 or earlier. Learn more about using the app
Please note we cannot support devices running on iOS 13 and Android 7 or earlier. Learn more about using the app
Yes, you can access Understanding Multivariate Research by William Berry,Mitchell Sanders in PDF and/or ePUB format, as well as other popular books in Social Sciences & Social Science Research & Methodology. We have over 1.5 million books available in our catalogue for you to explore.