Getting accurate data on less developed countries has created great problems for studying these areas. Yet until recently students of development economics have relied on standard econometrics texts, which assume a Western context. Econometrics and Data Analysis for Developing Countries solves this problem. It will be essential reading for all advanced students of development economics.
eBook - ePub
Econometrics and Data Analysis for Developing Countries
- 520 pages
- English
- ePUB (mobile friendly)
- Available on iOS & Android
eBook - ePub
Econometrics and Data Analysis for Developing Countries
About this book
Trusted by 375,005 students
Access to over 1 million titles for a fair monthly price.
Study more efficiently using our study tools.
Information
Subtopic
Business GeneralIndex
EconomicsPart I
Foundations of data analysis
1
Model specification and applied research
1.1 Introduction
In development research, most research questions typically involve relations between two or more variables. Regression provides a powerful tool to investigate such relations empirically. This book deals with applied regression as a research tool. Applied regression is about modelling data, a complex process of the evolving specification, estimation, evaluation and interpretation of a model (Granger, 1990: 1). Good modelling requires an active dialogue between theoretical reflection and empirical evidence to arrive at a model which presents an adequate, yet parsimonious, approximation of the underlying mechanisms helping to bring about the phenomena to be explained.
You may find the task of modelling data rather daunting notwithstanding the fact that you may have received prior basic training in statistical or econometric principles. Working with real data always turns out to be less straightforward and definitely more messy than conventional textbooks make it out to be. Part of the problem is that good modelling is both an art as well as a science and, hence, a good grounding in statistical and econometric theory is necessary but not sufficient. But it is equally true that traditional textbooks in statistics or econometrics do not always address the type of concerns which are foremost in the mind of applied researchers. They often pay undue attention to estimation and hypothesis testing within the confines of a given model, but have little to say about the difficulties involved in arriving at an appropriate model specification in the first place. In other words, traditional texts tend to assume that a researcher is fully equipped with a correctly specified model which he or she seeks to estimate or test against data specifically sampled for that purpose. In applied work, however, we cannot make this assumption so easily. In fact, model creation or selection is often the most creative and exciting but also frustrating aspect of doing research. The search for an appropriate model which answers the research question of an empirical study is more often than not the main preoccupation of an applied researcher. But, unfortunately, traditional textbooks in statistics and econometrics remain rather silent on this issue. This book puts the emphasis squarely on modelling data by applied regression analysis. Obviously, to do this we shall make extensive use of regression theory within the context of formal statistical inference. But, while reviewing the basics of regression theory, our point of view will consistently be that of an applied researcher who seeks to put to use what he or she has learned in statistics or econometrics courses in a context where he or she is preoccupied with finding out what the appropriate model is that best answers the research question which guides empirical work. It is this viewpoint which gives this book its particular flavour.
This chapter addresses the question of the role that data play in model specification. This is not an easy question nor is there agreement as to its possible answers. It is, however, a question of great practical significance. The way you answer this question will shape the modelling strategies you are likely to adopt or consider permissible, although it is not uncommon for a researcher to profess one answer in principle, yet behave quite differently in practice. The key issue is whether data have a role to play in model creation or whether they should only be used to test a given model or estimate its unknown parameters. In other words, do we only test ideas against the data or do we also get ideas from analysing data? This is a highly contentious issue which underlies debates on modelling strategies in applied research. Section 1.2 gives a simple framework to clarify the connection between statistical inference (model estimation and testing), on the one hand, and model specification, on the other. Section 1.3 then discusses traditional econometric modelling in which data were not meant to play any role in model specification, although in applied work ad hoc modifications were made to improve a model. In modern parlance, as a result of mounting criticism against this approach, this type of modelling is known as specifìc-to-general modelling or the average economic regression. Section 1.4 discusses three modern approaches to modelling: general-to-specific modelling, exploratory data analysis, and fragility analysis (known, more technically, as extreme bounds analysis). Finally, section 1.5 briefly discusses the distinction between cross-section and time-series data in the light of the problems they pose in terms of modelling data.
1.2 Model Specification and Statistical Inference
In development research, our interest is to investigate relations between two or more variables. The types of relations we are talking about seldom concern exact relationships between variables unless we are dealing with identities in a context of accounting frameworks. Typically, our problem is to come to grips with relations between variables in non-deterministic situations in which regularity of data goes hand in hand with considerable random error fluctuations. For example, Engel’s law, which postulates that the share of food expenditures in total household expenditure falls as household income rises, does not imply that two households with equal income will spend an equal amount of money on food. On the contrary, Engel’s law at most refers to an average relation. Hence, most of the relations we investigate in applied work tend to be blurred due to unaccountable erratic variation in the data. The types of relations we deal with, therefore, are essentially imperfect.
This is the reason why we rely on statistical modelling to analyse relations between economic variables. Typically, statistical data display two distinctive features: a regularity of some kind coupled with erratic variation. A statistical model based on probability theory seeks to capture both these components (regularity and error variation) in a single specification, a model, of the way the data behave. This theoretical stochastic specification, therefore, embraces both a systematic structural component (which can be a simple average or a more complex average relation between several variables) and a random component, which taken together account for the total variation in the dependent variable.
The easiest way to think about this distinction between regularity and residual random variations is to reflect on the difference between sound and noise. If you listen to a badly tuned radio, you will have difficulties in distilling the meaningful message (the sound) in the midst of the interfering noise. Statistical modelling tries to do something similar when analysing variability in data. The aim is to extract a meaningful message (the systematic component) in the midst of erratic variations (the noise element). A well-specified model, then, conveys a clear message (sound) surrounded by unexplained and irreducible error variation (noise). What matters is not just that the structural part of the model is theoretically meaningful and incisive, but also that the noise component no longer contains any significant messages. Perhaps paradoxically, therefore, to check whether an estimated model is reasonably adequate we need to take a good look at the residual variation it leaves unexplained to see whether it no longer contains hidden messages which signal that the model is probably mis-specified. Put differently, to test for model adequacy we do not just look at the message its structural component conveys, but we also scrutinise its residual variation to check whether it leaves things unsaid.
A statistical model, therefore, is an abstraction we use to characterise and explain the variability in real data. It is a theoretical construction in a double sense. First, to model the data we draw upon substantive theory (e.g. economics, population studies, social analysis), and second, we also rely on probability and statistical theory to model the stochastic nature of the relations between variables. Both sources of theoretical inspiration – substantive theory and statistical theory – do not join together, however, in an additive fashion. As we shall see repeatedly in this book, modelling does not just involve tagging on a random component after the substantive analysis has been completed. The choice of the random component, the error term, is itself an important part of the modelling exercise.
An empirical study involves a dialogue between theory and empirical evidence so as to arrive at an explanation which provides an adequate answer to our research question. This dialogue implies a confrontation between abstract theory-inspired models and the data, in a process which is generally interactive. Figure 1.1 provides a schematic overview based on Giere (1991: 126–8). It has a simple but powerful message.
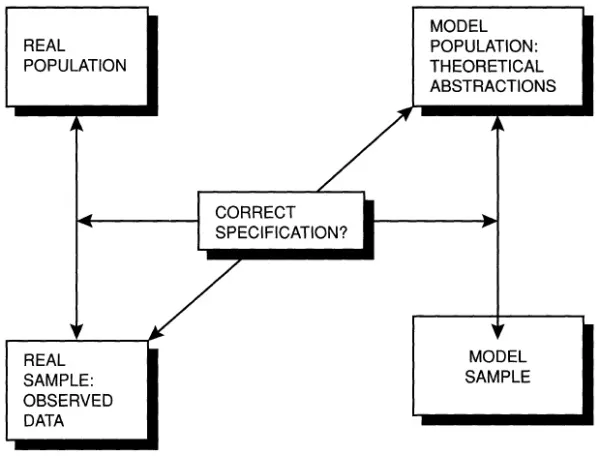
Figure 1.1 The elements of a statistical study
Source: Adapted from Giere, 1991: 126–8.
Giere makes a distinction between the four components of a statistical study: the real population, the real sample, the model population and the model sample. To start with, in statistical analysis we sample data from a real population so as to be able to make valid inferences from the real sample about its population. In other words, we seek to generalise our conclusions derived from a sample beyond the confines of the sample. To do this, however, we need to make explicit assumptions about the character of the real population and about the nature of the sampling procedure. This is where theoretical abstractions come into play. The model population is a hypothetical theoretical construction (a model) which depicts our assumptions about the character of the real population. It is, therefore, a theoretical population which behaves exactly in accordance with our assumptions. Finally, a model sa...
Table of contents
- Cover Page
- Half Title Page
- Priorities for development economics
- Title Page
- Copyright Page
- Contents
- List of Figures
- List of Tables
- List of Boxes
- Preface
- Introduction
- Part I Foundations of data analysis
- Part II Regression and data analysis
- Part III Analysing cross-section data
- Part IV Regression with time-series data
- Part V Simultaneous equation models
- The data sets used in this book
- Statistical tables
- References
- Index
Frequently asked questions
Yes, you can cancel anytime from the Subscription tab in your account settings on the Perlego website. Your subscription will stay active until the end of your current billing period. Learn how to cancel your subscription
No, books cannot be downloaded as external files, such as PDFs, for use outside of Perlego. However, you can download books within the Perlego app for offline reading on mobile or tablet. Learn how to download books offline
Perlego offers two plans: Essential and Complete
- Essential is ideal for learners and professionals who enjoy exploring a wide range of subjects. Access the Essential Library with 800,000+ trusted titles and best-sellers across business, personal growth, and the humanities. Includes unlimited reading time and Standard Read Aloud voice.
- Complete: Perfect for advanced learners and researchers needing full, unrestricted access. Unlock 1.4M+ books across hundreds of subjects, including academic and specialized titles. The Complete Plan also includes advanced features like Premium Read Aloud and Research Assistant.
We are an online textbook subscription service, where you can get access to an entire online library for less than the price of a single book per month. With over 1 million books across 990+ topics, we’ve got you covered! Learn about our mission
Look out for the read-aloud symbol on your next book to see if you can listen to it. The read-aloud tool reads text aloud for you, highlighting the text as it is being read. You can pause it, speed it up and slow it down. Learn more about Read Aloud
Yes! You can use the Perlego app on both iOS and Android devices to read anytime, anywhere — even offline. Perfect for commutes or when you’re on the go.
Please note we cannot support devices running on iOS 13 and Android 7 or earlier. Learn more about using the app
Please note we cannot support devices running on iOS 13 and Android 7 or earlier. Learn more about using the app
Yes, you can access Econometrics and Data Analysis for Developing Countries by Chandan Mukherjee,Howard White,Marc Wuyts in PDF and/or ePUB format, as well as other popular books in Economics & Business General. We have over one million books available in our catalogue for you to explore.