- 488 pages
- English
- ePUB (mobile friendly)
- Available on iOS & Android
eBook - ePub
Thinking With Data
About this book
The chapters in Thinking With Data are based on presentations given at the 33rd Carnegie Symposium on Cognition. The Symposium was motivated by the confluence of three emerging trends: (1) the increasing need for people to think effectively with data at work, at school, and in everyday life, (2) the expanding technologies available to support peopl
Trusted by 375,005 students
Access to over 1.5 million titles for a fair monthly price.
Study more efficiently using our study tools.
Information
Subtopic
Cognitive Psychology & CognitionIndex
PsychologyI
Reasoning About Uncertainty and Variation
1
Separating Signal From Noise: Children’s Understanding of Error and Variability in Experimental Outcomes
Hofstra University
Carnegie Mellon University
Grand Valley State University
A young child eagerly awaits the day when she will pass the 100 cm minimum height requirement for riding on the “thriller” roller coaster at her local amusement park. She regularly measures her height on the large-scale ruler tacked to her closet door. As summer approaches, she asks her parents to measure her every week. A few weeks ago she measured 98 cm, last week 99.5 cm, but today only 99.0 cm. Disappointed and confused, when she gets to school, she asks the school nurse to measure her and is delighted to discover that her height is 100.1 cm. Success at last! But as she anticipates the upcoming annual class excursion to the amusement park, she begins to wonder: what is her real height? And more importantly, what will the measurement at the entrance to the roller coaster reveal? Why are all the measurements different, rather than the same? Because she is a really thoughtful child, she begins to speculate about whether the differences are in the thing being measured (i.e., maybe her height really doesn’t increase monotonically from day to day) or the way it was measured (different people may use different techniques and measurement instruments when determining her height).
As this hypothetical scenario suggests, children often have to make decisions about data, not only in formal science classroom contexts, but also in everyday life. However, data vary. Data are imperfect both in the “real world” and in science classrooms. Learning when that variation matters and when it does not—separating the signal from the noise—is a difficult task no matter what the context. Children have two disadvantages in interpreting data. First, they have no formal statistical knowledge, which makes it impossible for them to fully assess the properties of the data in question. Second, children’s limited experience makes it difficult for them to detect data patterns and to formulate coherent expectations—based on nascent theories—about natural phenomena.
In contrast, adults with formal statistical training can use those tools in the science laboratory to distinguish real effects from error, or effects caused by factors other than the ones being explored. When statistical tools reveal that observed differences are highly unlikely to have occurred by chance, those with statistical training can feel more confident about drawing conclusions from data. Another critical component to such reasoning is theory, which we define as the background knowledge and experience brought to the task that influences decisions about the importance of variability and the reasonableness of the conclusions. This theoretical context may include hypotheses about potential mechanisms that lead to observed outcomes, but may also be a simple statement that events are related or that they do not contradict explanations of other phenomena. The theoretical component involves any claims about the data, based on information other than the data themselves.
In everyday reasoning, for those with or without statistics training, deeply held beliefs require large and consistent discrepancies between expected outcomes and empirical discrepancies before theory revision can take place. From a Bayesian perspective, the impact of new evidence is modulated by the size of the prior probabilities. For example, if a person has seen 1,000 instances of events x and y co-occurring, one instance of x occurring by itself is unlikely to change the expectation that the next instance of x is likely to be paired with y. And even in the classic Fisherian statistical world of t-tests and ANOVAs, the significance of statistical results is always tempered by a theory-embedded interpretation. In all scientific disciplines, strongly held hypotheses require a lot of disconfirming evidence before they are revised, whereas those with less theoretical grounding are more easily revised so as to be consistent with the latest empirical findings.
But how does a child determine when such variation matters? As just discussed, knowledge guides interpretations of data yet data also guide the evaluation and creation of knowledge. There seem to be (at least) two plausible developmental explanations: knowledge precedes data or data precede knowledge. Although these characterizations are slightly exaggerated, it is useful to examine the implications of each. It is possible that children only begin to attend to data when they detect inconsistencies with their existing knowledge. For example, the child in our opening scenario who holds the belief that growth is a monotonic function—and that therefore her height will always increase—will use that “theory” to interpret any measurement indicating a “loss” of height, as inconsistent with the current theory. This anomaly may motivate a more careful and skeptical analysis of the discrepant measurement. She might look for and evaluate a series of possible explanations that account for the unexpected data (Chinn & Brewer, 2001). Thus, through the detection of theoretical inconsistencies, children might begin to attend to data and these data, in turn, provide information on the type and extent of knowledge change that is necessary.
Conversely, it is also possible that knowledge is the result of data accumulation. Perhaps children detect patterns in their environment and use the data as the basis for conceptual groupings. For example, it has been suggested that several facets of language acquisition (e.g., phoneme tuning) are derived from the statistical structure of the child’s language environment. In phoneme learning, once the acoustical properties of a set of phonemes have been derived, children prefer these sounds to novel sounds (Jusczyk, Friederici, Wessels, Svenkerud, & Jusczyk, 1993). Once established, these conceptual units might anchor expectations about the probability of occurrences in the environment. A possible consequence of such an expectation is that deviations from the established data patterns (e.g., statistical structure) provide evidence of variation and may require changes in current knowledge.
We argue that theoretical, background knowledge and data dynamically interact in reasoning. That is, the tendency to attend to theoretical claims and explanations, or to specific data will be driven by the degree to which each element matches (or does not match) current knowledge. Many researchers have noted that theory influences the interpretation of data (e.g., Chinn & Malhotra, 2002; Koslowski, 1996; Kuhn & Dean, 2004; Schauble, 1996; see Zimmerman, 2005 for a review). For example, people often discount data that contradict their current knowledge. Yet few researchers have examined the role of data in modifying theory (cf. Dunbar, Fugelsang, & Stein, this volume). Further, there has been little research in which the interaction between reasoning about information based on prior knowledge and reasoning explicitly about data characteristics has been examined.
Beliefs based on background knowledge or context are one key component in drawing conclusions. However, another important, often overlooked component in decision making involves beliefs about characteristics of data. In the science laboratory, these beliefs are usually formalized in the use of statistics, but for children, these beliefs are based on a basic knowledge of probability and informal notions of statistics.
National Science Education standards urge teachers to develop children’s critical thinking skills that include “deciding what evidence should be used and accounting for anomalous data” (NRC, 2000, p. 159). In conducting authentic scientific investigations, students encounter variability and error in data collection and need to discriminate meaningful effects from experimental errors. In addition, to “account for anomalous data,” students need to understand the various sources of error (e.g., procedural errors, uncontrolled variables, experimenter bias). This knowledge provides a foundation for evaluating evidence and drawing conclusions based on scientific data. Thus, it is not sufficient (though necessary) for students to be able to analyze data using mathematical and statistical procedures. Rather, it is essential for students to be able to reason meaningfully and coherently about data variability itself.
In this chapter, we examine the relative roles of reasoning context and data characteristics when children and adults reason about error. First, we describe the framework that has guided our research in this area, and then we discuss three empirical studies of these issues.
Error Taxonomy
One way to consider data use in science education is to consider data in the context of an experiment, noting that data variation can occur in any of a series of places. Variation and the interpretation of the variation can have different consequences at different stages of an experiment. To structure the approach to looking at these issues, we developed a taxonomy of types of errors, considering errors by the phase of experimentation during which they occur (Masnick & Klahr, 2003), building on Hon’s earlier epistemological taxonomy of error (1989). The taxonomy is summarized in Table 1.1.
Table 1.1 Experimentation Phases and Error Types
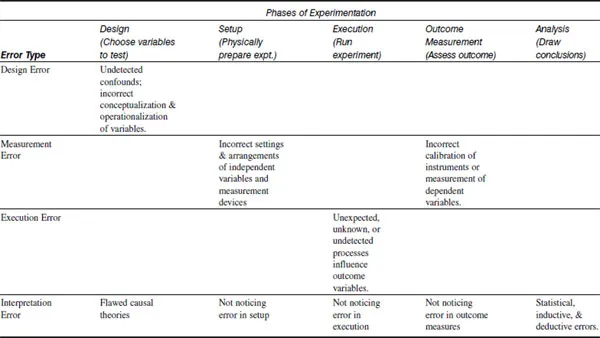
Note. From “Error matters:An Initial Exploration of Elementary School Children’s Understanding of Experimental Error”by A. M. Masnick & D. Klahr,Journal of Cognition and Development,4,p. 70. Copyright © 2003 by Lawrence Erlbaum Associates. Reprinted with permission.
The taxonomy identifies five stages of the experimentation process and four types of error that can occur during these stages. Our description is couched in terms of a simple ramps experiment in which participants are asked to set up two ramps such that they can be used to test the effect of a particular variable, such as the surface of the ramp, on the distance a ball travels. A correct test involves setting up two ramps with identical settings on every level except surface, running the test, and then measuring and interpreting the results.
We distinguish five stages in the experimentation process: design (choosing variables to test), set-up (physically preparing the experiment), execution (running the experiment), outcome measurement (assessing the outcome), and analysis (drawing conclusions). Each stage is directly associated with a different category of error.
Design Error
Decisions about which factors to vary and which to control are made in the design stage. These decisions are based on both domain-general knowledge, such as how to set up an unconfounded experiment, and domain-specific knowledge, such as which variables are likely to have an effect and therefore should be controlled. Domain-specific knowledge is used to form the operational definitions of the experiment’s independent and dependent variables.
Design error occurs in this stage of an experiment when some important causal variables not being tested are not controlled, resulting in a confounded experiment. Design errors occur “in the head” rather than “in the world,” because they result from cognitive failures. These failures can result from either a misunderstanding of the logic of unconfounded contrasts, or inadequate domain knowledge (e.g., not considering steepness as relevant to the outcome of a ramps comparison).
Measurement Error
Measurement error can occur during either the set-up stage or the outcome measurement stage. Error in the set-up stage is associated with the readings and settings involved in arranging the apparatus and calibrating instruments, and error in the outcome measurement stage is associated with operations and instruments used to assess the experimental outcomes. Measurement always includes some error, producing values with some degree of inaccuracy. These inaccuracies can affect either the independent or the dependent variables in the experiment. Of the four types of error, measurement error most closely corresponds to the conventional view of an error term that is added to a true value of either the settings of the independent variables or the measurement of the dependent variables.
Execution Error
The execution stage covers the temporal interval during which the phenomenon of interest occurs: in other words the time period when the experiment is “run.” For example, in the ramps experiment, this stage lasts from when the balls are set in motion until they come to rest. Execution error occurs in this stage when something in the experimental execution influences the outcome. Execution error can be random (such that replications can average out its effects) or biased (such that the direction of influence is the same on repeated trials), and it may be obvious (such as hitting the side of the ramp) or unobserved (such as an imperfection in the ball).
Interpretation Error
Although interpretation occurs during the final stage—analysis—interpretation error can be a consequence of errors occurring in earlier stages and propagated forward. That is, undetected errors in any stage of the experiment can lead to an interpretation error. For example, not noticing the ball hitting the side of the ramp as it rolls down might lead one to be more confident than warranted in drawing conclusions about the effect of the ramp design.
Even if there are no earlier errors of any importance, interpretation errors may occur in this final stage as conclusions are drawn based on the experimental outcome and prior knowledge. Interpretation errors may result from flawed reasoning strategies, including inadequate understanding of how to interpret various patterns of covariation (Amsel & Brock, 1996; Shaklee & Paszek, 1985) or from faulty domain knowledge that includes incorrect causal mechanisms (Koslowski, 1996). Both statistical and cognitive inadequacies in this stage can result in what are conventionally labeled as Type I or Type II errors, that is, ascribing an effect when in fact there is none, or claiming a null effect when one actually exists.
Operationally, the assessment of interpretation errors must involve assessing both the conclusions drawn and one’s confidence in the conclusions. Sometimes this assessment is defined formally by considering whether a statistical test yields a value indicating how likely it is that the data distribution could have occurred by chance. Regardless of whether statistics are used, a final decision must be reached about (a) what conclusions can be drawn, and (b) the level of confidence appropriate to these conclusions.
Background Literature
Past research about children’s understanding of experimental error and data variability has come from a range of contexts and methodologies. Some researchers have examined understanding of probability whereas others have looked at understand...
Table of contents
- Cover
- Half Title
- Title Page
- Copyright
- Dedication
- Contents
- List of Contributors
- Preface
- Acknowledgments
- Part I: Reasoning about Uncertainty and Variation
- Part II: Statistical Reasoning and Data Analysis
- Part III: Learning from and Making Decisions with Data
- Author Index
- Subject Index
Frequently asked questions
Yes, you can cancel anytime from the Subscription tab in your account settings on the Perlego website. Your subscription will stay active until the end of your current billing period. Learn how to cancel your subscription
No, books cannot be downloaded as external files, such as PDFs, for use outside of Perlego. However, you can download books within the Perlego app for offline reading on mobile or tablet. Learn how to download books offline
Perlego offers two plans: Essential and Complete
- Essential is ideal for learners and professionals who enjoy exploring a wide range of subjects. Access the Essential Library with 800,000+ trusted titles and best-sellers across business, personal growth, and the humanities. Includes unlimited reading time and Standard Read Aloud voice.
- Complete: Perfect for advanced learners and researchers needing full, unrestricted access. Unlock 1.5M+ books across hundreds of subjects, including academic and specialized titles. The Complete Plan also includes advanced features like Premium Read Aloud and Research Assistant.
We are an online textbook subscription service, where you can get access to an entire online library for less than the price of a single book per month. With over 1.5 million books across 990+ topics, we’ve got you covered! Learn about our mission
Look out for the read-aloud symbol on your next book to see if you can listen to it. The read-aloud tool reads text aloud for you, highlighting the text as it is being read. You can pause it, speed it up and slow it down. Learn more about Read Aloud
Yes! You can use the Perlego app on both iOS and Android devices to read anytime, anywhere — even offline. Perfect for commutes or when you’re on the go.
Please note we cannot support devices running on iOS 13 and Android 7 or earlier. Learn more about using the app
Please note we cannot support devices running on iOS 13 and Android 7 or earlier. Learn more about using the app
Yes, you can access Thinking With Data by Marsha C. Lovett,Priti Shah in PDF and/or ePUB format, as well as other popular books in Psychology & Cognitive Psychology & Cognition. We have over 1.5 million books available in our catalogue for you to explore.