It is not necessary to know how to do a statistical analysis to critically appraise a paper. However, it is necessary to have a grasp of the basics, of whether the right test has been used and how to interpret the resulting figures. Short, readable, and useful, this book provides the essential, basic information without becoming bogged down in the

- 126 pages
- English
- ePUB (mobile friendly)
- Available on iOS & Android
eBook - ePub
Medical Statistics Made Easy
About this book
Trusted by 375,005 students
Access to over 1.5 million titles for a fair monthly price.
Study more efficiently using our study tools.
Information
STATISTICS AT WORK
In this section we have given five real-life examples of how researchers use statistical techniques to describe and analyze their work.
The extracts have been taken from research papers published in the British Medical Journal (reproduced with permission of The BMJ Publishing Group). If you want to see the original papers, you can download them from the BMJ website http://www.bmj.com/
If you wish, you can use this part to test what you have learnt:
- First, go through the abstracts and results and note down what statistical techniques have been used.
- Then try to work out why the authors have used those techniques.
- Next, try to interpret the results.
- Finally, check out your understanding by comparing it with our commentary.
The following extract is reproduced with permission from The BMJ Publishing Group
Standard deviation, relative risk, confidence interval, chi-squared, and P values
Diggle, L. and Deeks, J. (2000). Effect of needle length on incidence of local reactions to routine immunisation in infants aged 4 months: randomised controlled trial. BMJ 321: 931–933.
Abstract
Objective: To compare rates of local reactions associated with two needle sizes used to administer routine immunisations to infants.
Design: Randomised controlled trial.
Setting: Routine immunisation clinics in eight general practices in Buckinghamshire.
Participants: Healthy infants attending for third primary immunisation due at 16 weeks of age: 119 infants were recruited, and 110 diary cards were analysed.
Interventions: Immunisation with 25 gauge, 16 mm, orange hub needle or 23 gauge, 25 mm, blue hub needle.
Main outcome measures: Parental recordings of redness, swelling, and tenderness for three days after immunisation.
Results: Shown in Table 9.
Table 9. Mean weights 4 month old infants and rate of local reactions to immunisation over 3 days by needle used for vaccination. Values are numbers of infants unless stated otherwise
What statistical methods were used and why?
At the time of the study, many clinicians were using the shorter (16 mm) needle as they assumed that it would cause less local reactions than the longer one. The researchers wished to know if this was indeed true, or whether use of longer needles might actually reduce the number of reactions.
Before analyzing the outcomes, the authors needed to know how comparable the two groups of babies were before they had their injections. They gave a number of comparisons of these “baseline characteristics”, but we have only quoted the mean weights.
The authors assumed that the weights of the babies were normally distributed, so compared the two groups by giving their mean weights.
They wanted to indicate how much the babies’ weights were spread around the mean, so gave the standard deviations of the weights.
As there were different numbers of babies in each group, percentages were given as a scale on which to compare of the number of babies getting reactions (the incidence of reactions).
This was a prospective study, following two cohorts of babies over 3 days, so relative risk was used to investigate the effect of the two different needles.
The authors wanted to give the range that was likely to contain the true relative risk, so gave it with its 95% confidence interval.
The null hypothesis was that there would be no difference between the number of reactions in the two groups. They used chi-squared (χ2) as a measure of the difference between actual and expected number of reactions.
From the Χ2 figure (not given by the authors) they calculated a P value giving the probability of the difference in risk between the two groups happened by chance.
What do the results mean?
The SD of the mean weight in each group was 0.9. In the 25 mm needle group:
1 SD below the average is 6.7 – 0.9 = 5.8 kg.
1 SD above the average is 6.7 + 0.9 = 7.6 kg.
±1 SD will include 68.2% of the subjects, so 68.2% of babies will have been between 5.8 and 7.6 kg.
95.4% weighed between 4.9 and 8.5 kg (±2 SD).
99.7% of the babies would have been between 4.0 and 9.4 kg (±3 SD).
33 babies out of 53 in the 25 mm needle group had a reaction. As a percentage, this is:
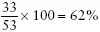
This is the same as the risk, or probability, that a reaction would happen in this group.
The risk ratio was calculated by dividing the risk in the 25 mm needle group with that in the 16 mm group:

The risk ratio of <1 shows that the rate of reactions in the 25 mm group was lower than that in the other babies.
The CI of 0.58–0.94 for the risk ratio does not include 1 (no difference in risk), so it is statistically significant.
The Χ2 value for the difference between actual and expected number of reactions was not given. However, the P value of 0.009 means that the probability of the difference having happened by chance is 9 in 1000. This is less than 1 in 100 and is therefore considered to be highly significant.
From the results of the research, the clinician can calculate ARR, NNT and RRR from changing to a 23 G, 25 mm needle.
ARR = [risk in the 25 mm group] – [risk in the 16 mm group] = 84 – 62 = 22%

So, for every five infants vaccinated, use of the longer needle instead of the shorter needle would prevent one infant from experiencing a local reaction.
The risk of reactions was reduced from 84% to 62% by using the longer needles, so the RRR is given by:

The researchers concluded that use of 25 mm...
Table of contents
- Cover Page
- Title Page
- Copyright Page
- Abbreviations
- Preface
- About the Authors
- Foreword
- How to Use this Book
- How this Book is Designed
- Percentages
- Mean
- Median
- Mode
- Standard Deviation
- Confidence Intervals
- P Values
- t Tests and other Parametric Tests
- Mann–Whitney and other Non-Parametric Tests
- Chi-Squared
- Risk Ratio
- Odds Ratio
- Risk Reduction and Numbers Needed to Treat
- Correlation
- Regression
- Survival Analysis: Life Tables and Kaplan–Meier Plots
- The Cox Regression Model
- Sensitivity, Specificity and Predictive Value
- Level of Agreement and Kappa
- Other Concepts
- Statistics at Work
- Glossary
Frequently asked questions
Yes, you can cancel anytime from the Subscription tab in your account settings on the Perlego website. Your subscription will stay active until the end of your current billing period. Learn how to cancel your subscription
No, books cannot be downloaded as external files, such as PDFs, for use outside of Perlego. However, you can download books within the Perlego app for offline reading on mobile or tablet. Learn how to download books offline
Perlego offers two plans: Essential and Complete
- Essential is ideal for learners and professionals who enjoy exploring a wide range of subjects. Access the Essential Library with 800,000+ trusted titles and best-sellers across business, personal growth, and the humanities. Includes unlimited reading time and Standard Read Aloud voice.
- Complete: Perfect for advanced learners and researchers needing full, unrestricted access. Unlock 1.5M+ books across hundreds of subjects, including academic and specialized titles. The Complete Plan also includes advanced features like Premium Read Aloud and Research Assistant.
We are an online textbook subscription service, where you can get access to an entire online library for less than the price of a single book per month. With over 1.5 million books across 990+ topics, we’ve got you covered! Learn about our mission
Look out for the read-aloud symbol on your next book to see if you can listen to it. The read-aloud tool reads text aloud for you, highlighting the text as it is being read. You can pause it, speed it up and slow it down. Learn more about Read Aloud
Yes! You can use the Perlego app on both iOS and Android devices to read anytime, anywhere — even offline. Perfect for commutes or when you’re on the go.
Please note we cannot support devices running on iOS 13 and Android 7 or earlier. Learn more about using the app
Please note we cannot support devices running on iOS 13 and Android 7 or earlier. Learn more about using the app
Yes, you can access Medical Statistics Made Easy by Michael Harris,Gordon Taylor in PDF and/or ePUB format, as well as other popular books in Medicine & Biostatistics. We have over 1.5 million books available in our catalogue for you to explore.