Fluorescence of Living Plant Cells for Phytomedicine Preparations reveals how valuable medicinal compounds can be identified through the application of vital fluorescence in plant cells. The book explains the roles that fluorescent compounds play in plant physiology and promotes our knowledge of plant secretory cells and phytopreparations. Supported by vivid illustrations, the book reveals how actinic light – light that induces fluorescence in leaves and flowers – can be used in the identification of secretory cells within plant tissue that may be the repository of valuable medicinal compounds.
The book demonstrates the potential of fluorescence in pharmacological analysis with detailed methods for applying fluorescence to identify these deposits of natural drugs. As such, this groundbreaking book contains methods of express-pharmaceutical analysis that could open new horizons in pharmacy and the cultivation of medicinal plants.
Features
Describes various fluorescence microscopy techniques for the localization of compounds contained in plants with pharmaceutical interest
Provides an analysis of pharmaceutical material based on autofluorescence and histochemical reactions for numerous medicinal plant species
Demonstrates practices for providing optimal growing conditions and improving the quality of the compounds
Showing the readiness of plant raw material for pharmaceutical industry, this book will appeal to professionals in the pharmaceutical industry and students and researchers in the fields of phytochemistry, botany and pharmaceutical sciences.
Trusted by 375,005 students
Access to over 1.5 million titles for a fair monthly price.
The visible fluorescence of intact living cells is termed the autofluorescence (often induced by ultraviolet [UV] or violet light) of naturally occurring molecules within intact cells or within organisms in the visible region of the spectrum. Recently, this parameter has represented a possible tool in the analysis of medicinal plants in pharmacy (Roshchina et al. 2016b; Roshchina 2017). Many medicinal plants contain valuable pharmaceuticals in secretory cells (Roshchina and Roshchina 1993; Roshchina 2008). Analysis of the fluorescence emitted from secretory cells and secretions of the cells in medicinal plants is based on the comparison of the emission spectra with those of the individual compounds (drugs) of the species. A researcher may see either a prevailing emission characteristic of an individual component (an alkaloid, for example) or a complex picture of the emission of multiple compounds. The aim of this chapter is to show fluorescent techniques as possible tools for pharmacy: either in vivo histology (mainly autofluorescence) of secretory cells in medicinal plants or with the application of fluorescent dyes. Autofluorescence could be used (i) in express microanalysis of the accumulation of secondary metabolites in secretory cells without long biochemical procedures; (ii) in diagnosis of cellular damage; and (iii) in analysis of cell–cell interactions (Roshchina 2003, 2008; Roshchina et al. 2007, 2008, 2009). The phenomenon is of interest for studying the appearance of the secretory structures and their development in medicinal plants as well as for the accumulation and identification of natural drugs. In pharmacy, the application of fluorescent dyes or probes for cellular and tissue reactions may also be used in the study of some drugs or important natural compounds (Haugland 2001). In any case, the realization of these directions requires the inclusion of fluorescent techniques in pharmaceutical practice and laboratory investigations.
1.1 Fluorescent Analysis Tools
The phenomenon of fluorescence may be observed in intact tissues and cells under the usual luminescent microscope or its various modifications. Earlier, registration of the emission spectra was measured in solutions (extracts from tissues) using spectrofluorimeters, but today, there are techniques that enable this to be done in vivo. In the following, we shall consider apparatuses that are often applied to the study of fluorescence of living plant systems and extracts from the samples. Among the methods mentioned in the section are those that are most suitable for the practice of pharmaceutical and agrochemical laboratories as well as those that are developing and are rarely used as yet but have potential for the future.
1.1.1 Apparatuses
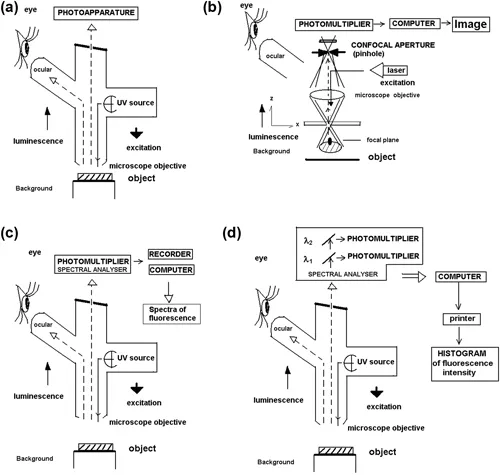
Luminescence and laser-scanning confocal microscopy (LSCM) may produce images of high quality using fluorescing cells of a luminescence microscope, in which one can see the fluorescing object in a whole field of view (Karnaukhov 1978; Pawley and Centonze 1994; Pawley and Pawley 2006; Roshchina et al. 1972, 1978, 1988, 2001, 2004, 2007; Yeloff and Hunt 2005; Roshchina 2007b, 2008). The principal schemes of the technique are represented in Figure 1.1. Under luminescence microscope, investigators may see and photograph emitted secretory cells among nonsecretory ones and the location of fluorescent secretions in certain compartments within cell. This may be applied to pharmacy in any laboratory. If it is necessary to measure the fluorescence intensity or register the fluorescence spectra, microspectrofluorimetry or some type of confocal microscope will be used. We cannot describe the characteristics of this technique here and refer the reader to specialized literature. Our aim in this chapter is only to show the possibilities of some types of apparatus for pharmacologists.
FIGURE 1.1 Main technique used for the analysis of plant fluorescence. (a) Luminescent microscopy; (b) confocal microscopy; (c) microspectrofluorimetry with registration of the spectra; (d) double-beam (dual-wavelength) microspectrofluorimetry with registration of histograms.
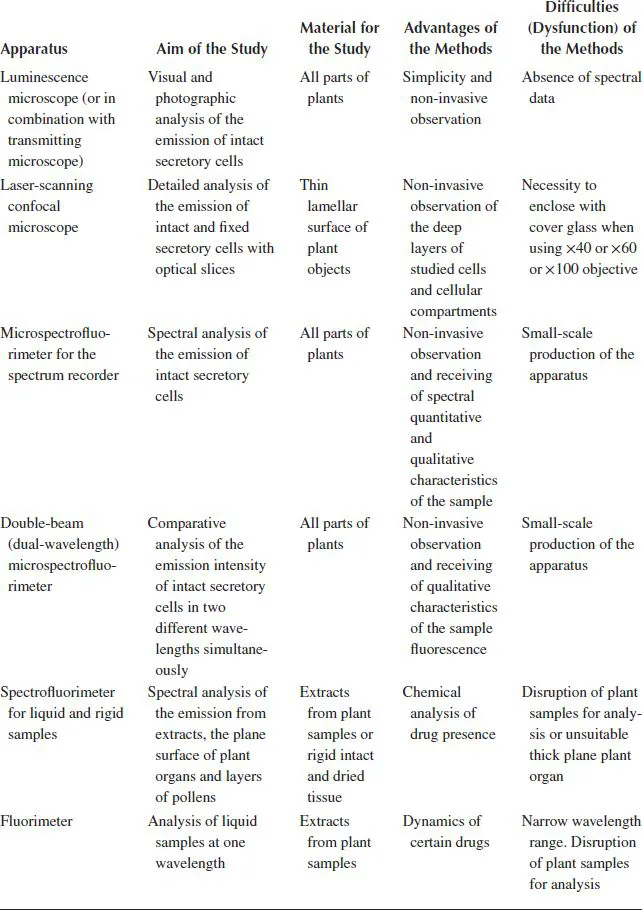
Table 1.1 shows the types of apparatus used for the study of plant secretory cells. It lists the advantages and difficulties in the use of each technique as well as their industrial potential for future scientific needs. The table allows the reader to evaluate the application of apparatuses for a particular task. As seen from Table 1.1, the problems for determination do not lie only in the construction of the technique. Accessibility and industrial promotion also have a place. We shall demonstrate these methods using concrete examples in Chapters 2 through 4. Looking forward, the attention of scientists also needs to be drawn to new techniques from the perspective of the future.
TABLE 1.1 Techniques for the Study of Fluorescent Plant Samples Used Today
The first basic method of fluorimetry for living cells was luminescence microscopy. The first steps in the creation of this type of microscopy took place at the beginning of the 20th century. The first observation of chlorophyll fluorescence in plant cells under a microscope was made by the Russian scientist Tswett (1911). Today, he is mainly known as a pioneer of chromatography. The improvement of fluorescence microscopy led to the construction of microspectrofluorimeters for the registration of the emission spectra (Chance and Thorell 1959). The development of microspectrofluorimetry as a method with patents (Karnaukhov et al. 1982, 1983) brought new possibilities for the analysis of intact animal and plant cells, as described in a monograph (Karnaukhov 1978). However, the industrial application range of the apparatuses has been narrow up to now, notwithstanding most of their advantages. This technique is awaiting new employers who are able to make these apparatuses on an industrial scale. Similar non-invasive apparatuses, such as a luminescence microscope in combination with a transmitting microscope, are widespread in practice but cannot provide spectral data, unlike microspectrofluorimetry and spectrofluorimetry. Laser-scanning confocal microscopy apparatuses were developed parallel to the above-mentioned techniques and have been mainly used for fluorescent dyes and probes. Beginning from the year 2000, this technique has been included in many studies on plant systems due to the volume of images of the fluorescing sample structure received by laser excitation in the form of optical slices (then combined as a stack). However, some laser-scanning confocal microscopy apparatuses may record fluorescence spectra.
In the following, we will consider modern developed techniques for intact plant tissue that can be recommended for pharmacy as well as apparatuses that have great potential for the future.
1.1.2 Luminescence Microscopy
Using simple luminescence microscopy, we can see cellular emission (excited with the chosen wavelength) from intact cells with various objectives ×10–×40 and even without a cover glass. In a luminescent microscope, light from the UV source excites the fluorescence of the object. The luminescent image can be perceived directly by the eye of the observer.
The image and color of any fluorescent cell show the changes induced by many experimental factors. Plants enriched in secretory structures with biologically active secondary metabolites have fluorescing products in their cells, and the location of the compounds can be observed.
The fluorescence of objects that lie on the subject glasses (intact tissue or slices) excited by UV (360–380 nm), violet (400–420 nm), or green light (480–520 nm) may be seen in a luminescent microscope with multiplication of objectives ×10, 20, or 40, with water immersion ×85, or with immersion oil ×60 and 85.
Depending on the purpose, slices of fresh plant samples may be observed immediately or after fixation for following analysis. The advantages and disadvantages of the apparatus should be noted. A luminescence microscope (alone or in combination with a transmitting microscope) is used for visual and photographic analysis of the emission of intact fluorescing cells. The technique is simple and non-invasive for the cells, although it is impossible to measure spectral characteristics that may be measured by microspectrofluorimetry and confocal microscopy in some modifications. Fluorescence of intact cells under a luminescence microscope may be excited, for example by UV light, and photographed under a luminescence microscope that allows visualization of the emission after excitation at 340–380 nm. The investigator can distinguish secretory cells among nonsecretory cells and is able to see the object in one plane and photograph the color and location of the fluorescence in certain cellular compartments. Similar non-invasive apparatus (a luminescence microscope in combination with a transmitting microscope) is widespread but cannot be used for receiving spectral data.
1.1.3 Microspectrofluorimetry
The quantitative and qualitative spectral characteristics of living cells may be perceived using a microspectrofluorimeter (Chance and Thorell 1959; Karnaukhov 1972, 1978; Kohen et al. 1974; Karnaukhov et al. 1982, 1987; Weissenböck et al. 1987; Karnaukhova et al. 2010). The apparatus can receive a magnitude fluorescence image of a certain area of the specimen that appears on a spherical mirror. Microspectrofluorimeters, having a detector with optical probes of various diameters up to 2 μm (the changed areas or probe holes composed with the system of mirrors), have been constructed in the Institute of Cell Biophysics at the Russian Academy of Sciences (Karnaukhov et al. 1982, 1983, 1987; Karnaukhova et al. 2010). The emission data may be written in a form of the fluorescence spectra by the help of XY-recorder, which could be coupled with a computer (Figure 1.1). The fluorescence spectra were registered by microspectrofluorimeter MSF-1 at excitation 360–380 nm or 430 nm.
Depending on the aim of the study, the spectral features of the plant cells, secretory structures, and secretions in vivo measured with the technique give valuable information about chemical constituents (Roshchina and Melnikova 1995, 1996, 1999; Roshchina et al. 1997; Roshchina 2003, 2007a, 2008). The technique permits the visualization of direct contact of plant cells from foreign species, for example in the modeling of cell–cell contacts (Roshchina 2008; Roshchina et al. 2008, 2009). The fluorescence was excited by UV (360–380 nm) or violet light (420–435 nm). The fluorescence spectra were registered by microspectrofluorimeter MSF-1. The emission intensity (I) in two different spectral regions (in blue-green with maximum 530 nm and in red with maximum 640 nm) of whole microspore cells was recorded on a dual-wavelength microspectrofluorimeter (MSF-2) at room temperature (20–22 C). Intensity in blue-green (or green) and intensity in red were shown as histograms. The intensity of the emission at separate wavelengths may be measured. In this case, statistical analysis was possible for the total of 10–100 pollen grains examined on each slide. Results were expressed as mean ± standard error of the mean (SEM) relative units.
Among the first determinations of flavonoids (in situ) by microspectrofluorimetry were the work of Weissenböck and coworkers (1987). Later, this technique was applied to the effects of herbicides on the contents of flavonoids in various weed species of Poaceae (Hjorth et al. 2006).
Recently, Jamme and coworkers (2013) presented deep UV (DUV) autofluorescence microscopy for cell biology and tissue histology, unlike the above-mentioned microspectrofluorimeter, which used the visible spectral range of fluorescence. Synchrotron radiation is a broadband light that can monochromatize in almost any energy range. The DISCO beamline at the SOLEIL synchrotron optimizes the vacuum UV to the visible range of the spectrum, as defined by quartz cutoff from 200 nm to longer wavelengths (600 nm) (Jamme et al. 2010). The energies are accessible on two microscopes at atmospheric pressure. The authors developed a synchrotron-coupled DUV microspectrofluorimeter to which endogenous autofluorescent probes were presented. The probes were distributed in various biological samples, including cultured cells, soft tissues, bone sections, and maize stems. Although most biomolecules do present a contrasting DUV transmission microscopy, few of them will re-emit fluorescence. This autofluorescence is very important in the sense that it permits better discrimination of molecules. Moreover, following autofluorescence makes possible label-free studies of molecules of interest without any external probes or radiolabeling that could impair the activity of the molecule of interest. Although the application of the apparatuses is best known for diagnostic aims in medicine, such as cancer cell visualization, DUV excitation may be used in some cases for measurements of NAD(P)/NAD(P)H or phenols in plant samples: for example, maize sclerenchyma, parenchyma, and phloem studied by the apparatus at an excitation wavelength of 350 nm.
The principal methodical approach to the registration of spectral characteristics is the use of optical probes (seen as a part needed for the analysis) by both microspectrofluorimetry (stationary optical probes up to 2 µm in diameter) and confocal microscopy (regulated size and form of optical probes in one and the same image).
1.1.4 Laser-Scanning Confocal Microscopy
Unlike the usual luminescent microscope, a confocal microscope has a special confocal aperture (a pinhole), through which the fluorescence of an object excited by laser beam with a certain wavelength passes and is multiplied by a photomultiplier before visualization by the eye. The construction of aperture permits to the light beam be focused on different depth of the object. Unlike microspectrofluorimetry, laser-scanning confocal microscopes may take optical slices of the sample and receive the emission spectra from each slice that is needed for observation. The principal methodical approach to the registration of spectral characteristics is the use of optical probes (seen as a part needed for the analysis) by both microspectrofluorimetry (stationary optical probes up to 2 μm in diameter) and confocal microscopy (regulated size and form of optical probes in one and the same image). The advantages of LSCM as luminescence microscopy derived techniques are as follows: (1) 3-channel simultaneous detection that makes it possible to see images excited by 3 different wavelengths of laser light and to receive a common complicated interference image of the object; (2) the possibility of an increased depth of penetration to receive 20 visual slices (optical sections) or the complete volume (the information must be also quantitatively extracted); (3) interchangeable filters; (4) graphical user interface and the production of accurate computer models as well as mathematical analysis; and (5) pattern analysis of the structure. Earlier apparatuses were able to show images of objects at different depth, but some models also record the fluorescence spectra. Moreover, some confocal microscopes enable the display to be photographed and the image to be analyzed later by the user’s choice of optical probes. Biologists usually prefer inverted variants of confocal microscopes for pictures of the living sample.
The fluorescence image of the cells can be seen by air, water, or oil immersion with LSCM. Excitation by three types of lasers: Argon/2 (l 458, 488, 514 nm), HeNe1 (543nm) and HeNe2 (l 633 nm) is often used for the emission. Three photomultipliers were able to detect the fluorescence, either separately or simultaneously by using pseudocolor effects. The image analysis was carried out using different computer programs LSM 510, Lucida Analyse 5 and others. At the excitation by lasers with wavelengths of 405, 458, 488, 543 and 633 nm, the registration of the fluorescence was at range 505–630 nm and 650–750 nm, respectively. Pseudocolours were chosen according to the exciting wavelength blue for 488; green for 543 and red for 633nm. A summed image was seen when the images consisting of the pseudocolours were superimposed and mixed. Main secondary compounds of plants (phenols, terpenoids, alkaloids, etc.) were observed in visible ranges of 400–700 nm with all known techniques using lasers of 360–380 nm or 405 nm.
A well-visualized image of a cellular structure and optical slices of the object allow the demonstration of the changes induced by many experimental factors. Some types of confocal microscopes (Leica, Zeiss, and others) may also register the fluorescence spectra in different parts of the secretory cells. The fluorescence of the cells is observed and measured on subject glasses (slides). All experiments are carried out at ro...
Table of contents
Cover
Half-Title
Title
Copyright
Contents
Acknowledgments
Author
Introduction
Chapter 1 Fluorescent Analysis Technique
Chapter 2 Autofluorescence as a Parameter to Study Pharmaceutical Materials
Chapter 3 Atlas of Autofluorescence in Plant Pharmaceutical Materials
Chapter 4 Fluorescence in Histochemical Reactions
Chapter 5 Fluorescence in Phytopreparations
Conclusion
References
Index
Frequently asked questions
Yes, you can cancel anytime from the Subscription tab in your account settings on the Perlego website. Your subscription will stay active until the end of your current billing period. Learn how to cancel your subscription
No, books cannot be downloaded as external files, such as PDFs, for use outside of Perlego. However, you can download books within the Perlego app for offline reading on mobile or tablet. Learn how to download books offline
Perlego offers two plans: Essential and Complete
Essential is ideal for learners and professionals who enjoy exploring a wide range of subjects. Access the Essential Library with 800,000+ trusted titles and best-sellers across business, personal growth, and the humanities. Includes unlimited reading time and Standard Read Aloud voice.
Complete: Perfect for advanced learners and researchers needing full, unrestricted access. Unlock 1.5M+ books across hundreds of subjects, including academic and specialized titles. The Complete Plan also includes advanced features like Premium Read Aloud and Research Assistant.
Both plans are available with monthly, semester, or annual billing cycles.
We are an online textbook subscription service, where you can get access to an entire online library for less than the price of a single book per month. With over 1.5 million books across 990+ topics, we’ve got you covered! Learn about our mission
Look out for the read-aloud symbol on your next book to see if you can listen to it. The read-aloud tool reads text aloud for you, highlighting the text as it is being read. You can pause it, speed it up and slow it down. Learn more about Read Aloud
Yes! You can use the Perlego app on both iOS and Android devices to read anytime, anywhere — even offline. Perfect for commutes or when you’re on the go. Please note we cannot support devices running on iOS 13 and Android 7 or earlier. Learn more about using the app
Yes, you can access Fluorescence of Living Plant Cells for Phytomedicine Preparations by Victoria Vladimirovna Roshchina in PDF and/or ePUB format, as well as other popular books in Biological Sciences & Alternative & Complementary Medicine. We have over 1.5 million books available in our catalogue for you to explore.